Portfolios and Investing: If/When "Winter is Coming"?
Portfolios and Investing: If/When “Winter” is Coming?
The Northern Hemisphere, home to 90% of the world’s population, is celebrating the arrival of spring. But, be warned: “winter” is coming, and not just for fans of HBO blockbuster Game of Thrones. After a multi-year Federal Reserve (Fed) tightening cycle that turned the yield curve flat, an investment winter might be coming in stocks and U.S. Treasuries. If this Fed-induced investment winter is similar to the previous three, it could bring sharply positive returns for bond investors, especially at the short-end of the yield curve, and mediocre or even negative returns for equities.
We have written extensively about the existence of a volatility cycle that relate the easiness or tightness of monetary policy with the cost of options on a wide variety of products (equities, fixed income, currencies, energy, metals and even agricultural products) as well as with economic factors such as credit spreads and unemployment rates. (See our articles on The Yield Curve – Unemployment Feedback Loop; VIX-Yield Curve; and Credit Spread-Yield Curve). This approach differs from most economic analysis in that it doesn’t assume that variables like options prices, credit spreads or unemployment are a function of monetary policy or vice versa. Rather it observes over three decades that monetary policy is locked in a cycle (in mathematics, a relation and not a function) with options costs, credit spreads and unemployment that works as follows:
- Tight monetary policy, evidenced by a flat yield curve, eventually translate into rising implied volatility on options, widening credit spreads and increasing unemployment – usually after a period of 1-2 years.
- Rising unemployment, tight credit conditions and volatile markets oblige the central bank to ease policy, steepening the yield curve.
- Easy monetary policy, as evidenced by a steep yield curve, creates the conditions for an economic recovery with falling unemployment, narrowing credit spreads and easing of volatility (realized and implied).
- Eventually falling unemployment and calm financial markets will encourage the central bank to tighten policy and the cycle begins anew.
This paper builds on that analysis to look at investment returns (average annualized returns, realized volatility and information ratios) by giving precise, if somewhat arbitrary, definitions to four stages, or “investment seasons,” of the cycle:
- Spring/Early Recovery: High volatility (the two-year moving average of the VIX Index on S&P 500® options is greater than 16%) and easy monetary policy (the two-year moving average of the 30Y–3M* yield curve is greater than 200 basis points (bps) in steepness).
- Summer/Mid-Expansion: Low volatility (the two-year moving average of the VIX Index on S&P 500® options is less than 16%) and easy monetary policy (the two-year moving average of the 30Y–3M yield curve is greater than 200bps steepness).
- Fall/Late Expansion: Low volatility (the two-year moving average of the VIX is still below 16%) and tight monetary policy (the two-year moving average of the 30Y–3M yield curve has come down below 200bps).
- Winter/Recession: High volatility (the two-year moving average of the VIX Index on S&P 500® options is greater than 16%) and tight monetary policy (the two-year moving average of the 30Y–3M yield curve is less than 200bps steepness).
*30Y–3M yield curve is often referred to as 3M30Y, which is how we will label it from here.
By fixing the definition of the four phases of the cycle in terms of the degree of yield-curve steepness and the level of implied volatility on S&P 500® index options, the length of each investment season becomes variable. Sometimes, an investment season can pass in as little as nine months; at other times, it may last four to five years. As such, our investment seasons are much longer than the Earth’s calendar seasons but shorter than the seemingly difficult to predict and VERY LONG seasons – often lasting a human lifespan or more – on Westeros, the fictional continent on which most of the action in Game of Thrones takes place.
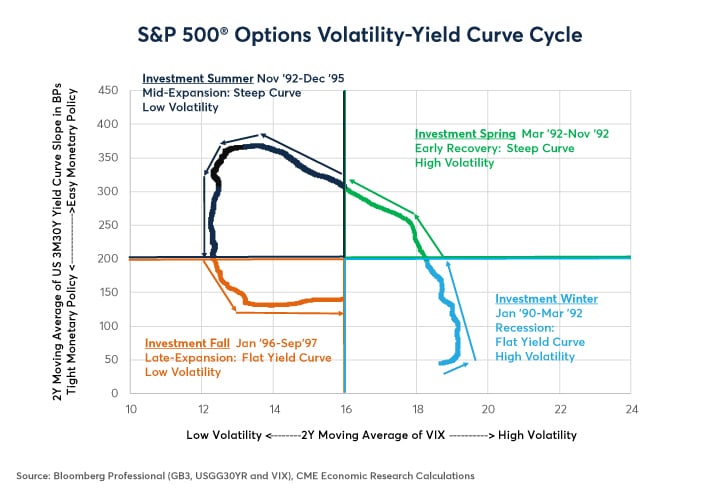
Since 1990, our investment cycle has gone through three (nearly) full cycles (Figures 1, 2 and 3).
Figure 1: Cycle 1 Lasted from End of the 1980s Until 1997.
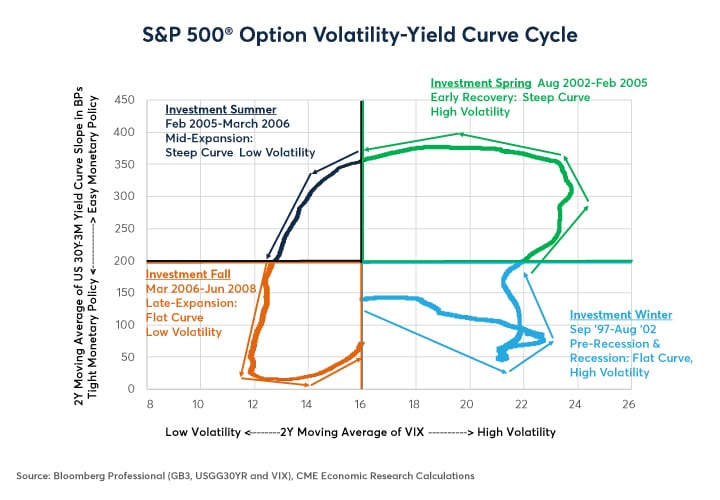
Figure 2: Cycle 2 Lasted from Late 1997 until Mid-2008.
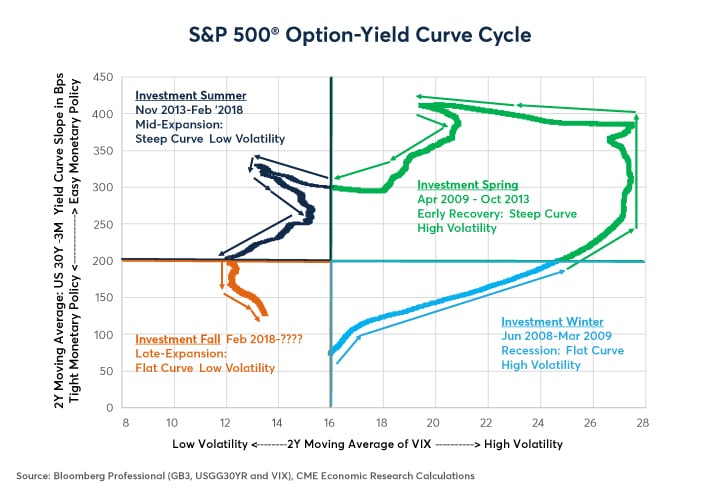
Figure 3: The Current Cycle Began in Mid-2008 and is Ongoing.
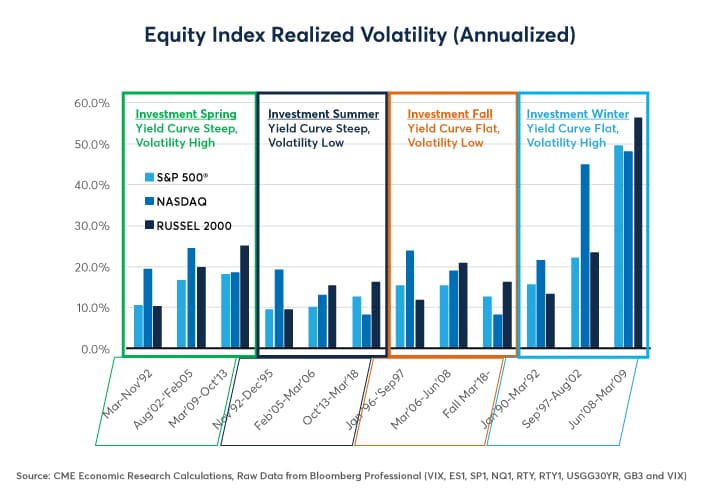
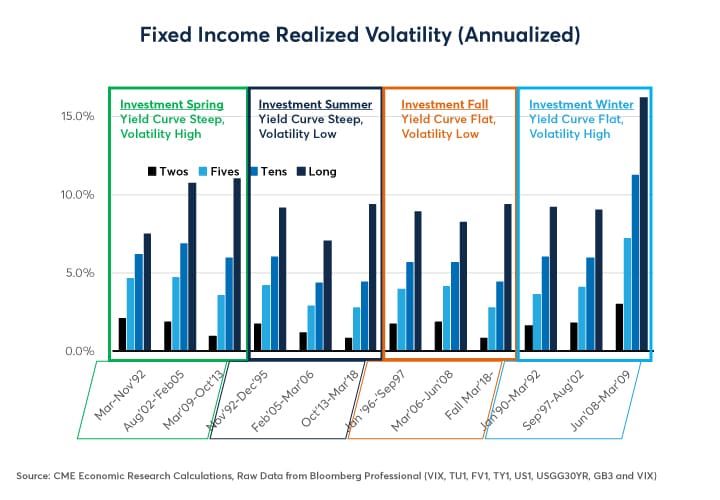
Not surprisingly, equities and bonds respond in very different ways to the stages of the investment-cycle, but they do have one thing in common: realized volatility tend to be much higher in the investment winters than it during the other seasons (Figures 4 and 5).
Figure 4: Realized Equity Volatility is Typically Highest in Recessions/investment Winters.
Figure 5: Bond Volatility is Highest after the VIX 2Y Moving Average Rises Above 16% and Yield Curve is Flat.
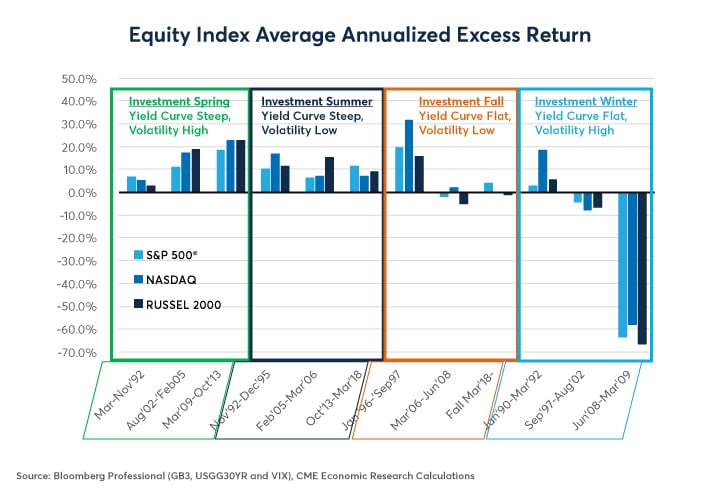
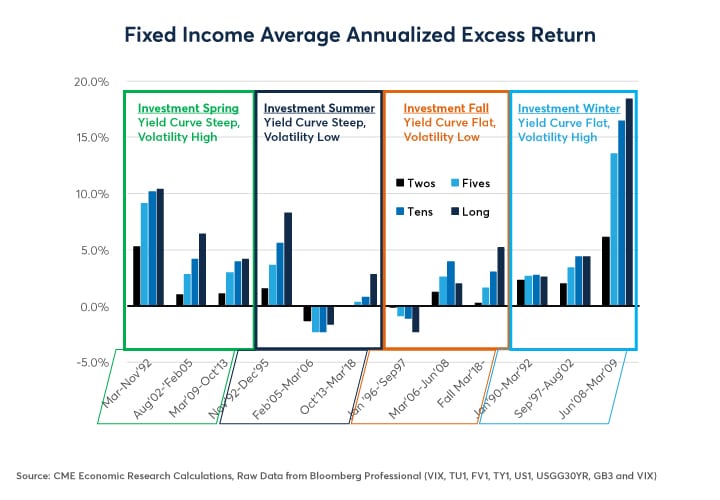
Between equities and bonds, investment returns differ greatly by season. Late expansion periods and recessions (investment falls and winters) tend to be bad for stocks and good for bonds (Figures 6 and 7).
Figure 6: Investment Winters/Recessions & Falls/Late Expansions Have Been Less Kind to Stockholders.
Figure 7: Bond Investors Often Enjoy “Wintertime” and “Springtime” Monetary Easing Bonanzas.
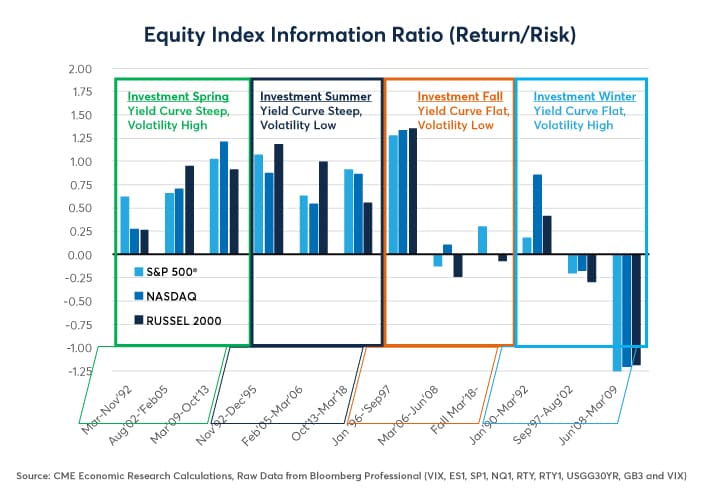
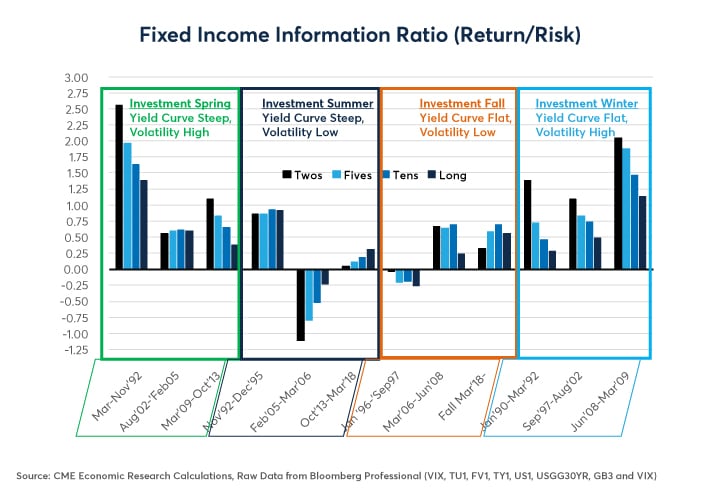
The seasonal differences of stock and bond recessions are more easily observed by looking at their respective information ratios (annualized excess returns/annualized standard deviations) (Figures 8 & 9).
Figure 8: “Springs” & “Summers” Have Had Better Equity Risk-Adjusted Returns Than “Falls” & “Winters.”
Figure 9: High Volatility Environments (“Winter” and “Spring”) are Often Good for Fixed Income.
A Chronology (See Figure 10 if you just want the numbers)
“Winter” 1990-1992: lasted from early January 1990 until March 25, 1992; Fed slashed rates as unemployment rose in the aftermath of the collapse of Drexel Burnham Lambert and the Savings & Loans Crisis. The oil price shock after Iraq invaded Kuwait in the summer of 1990 and the ensuing Persian Gulf War in early 1991 added to the turbulence. During this time, the biggest risk-adjusted outperformer was 2Y U.S. Treasuries, which turned in an information ratio of 1.38 far outpacing bond further up the curve and U.S. equities. That said, technology stocks did well (0.87 information ratio for the NASDAQ 100) while long bonds and the S&P 500® languished. Impressively, stock returns were still positive. This may have been a result of a relatively shallow recession (nowhere near as bad as the 1979-82 period or 2008 financial crisis) and the long period of relatively low equity valuations during the 1970s and 1980s that coincided with extremely high Treasury yields. The recession lowered inflation and allowed the Fed to cut rates to levels not seen since the early 1970s, boosting equities.
“Spring” 1992: a brief affair that lasted from March 26, 1992, when 3M30Y’s 2Y moving average was over 200bps, and November 26, 1992 when the 2Y moving average of the VIX slipped below 16%. This was a exceptional period for Treasuries with high return/risk ratios, especially at the short-end of the curve. The Fed continued to ease policy and a steep yield curve made carry/rolldown spectacular. Large cap equities delivered a respectable, if somewhat ho-hum, return after the Gulf War relief rally in 1991.
“Summer” 1992-96: beginning November 27, 1992, when the 2Y moving average of the VIX fell below 16%, and ending January 2, 1996, when 3M30Y’s 2Y moving average fell back below, 200bps, this investment summer delivered extremely solid risk-adjusted returns for equity investors (0.87-1.18 information ratios, depending on the index). Bonds did remarkably well and better than in any subsequent investment summer, benefitting from the powerful carry and rolldown implications of the ultra-steep yield curve in late 1992 until mid-1994 and from the fixed income relief rally in 1995 when the Fed stopped hiking rates. That said, 1994 was the worst year since the late 1970s for fixed income managers, who were hammered when the Fed hiked rates from 3% to 6% before lowering them back to 5.25% in early 1995.
“Fall” 1996-97: From January 3, 1996, when 3M30Y’s 2Y moving average crossed below 200bps, and September 15, 1997 when the VIX’s 2Y moving average rose above 16%, equities delivered a stellar performance with information ratios of between 1.27 and 1.35. This was not met with celebration by bond investors, who saw slightly negative excess returns (price + interest returns were less than the cost of funding). The approaching end of the millennia and optimism inspired by the advent of the internet may have contributed to the equity market’s “irrational exuberance,” as former Fed Chairman Alan Greenspan put it at the time.
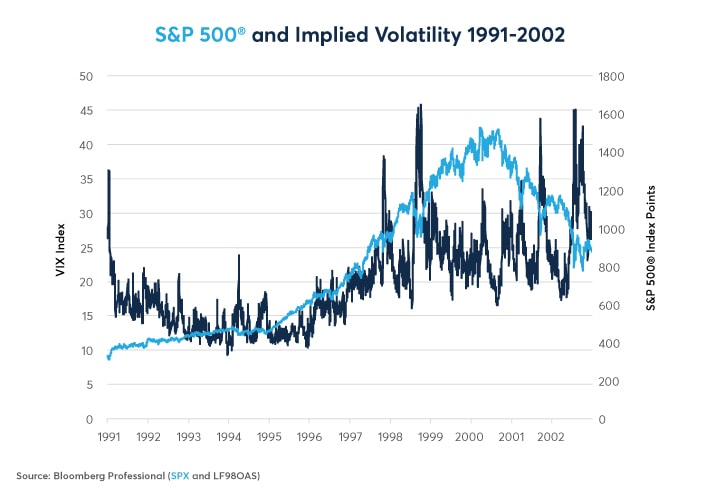
“Winter” 1997-2002: On September 16, 1997 the VIX’s 2Y moving average rose above 16% and stayed there for six years. This long, volatile “winter” lasted until August 8, 2002 when 3M30Y’s 2Y moving average rose above 200bps. This period was, to say the least, tumultuous for equity investors. Stocks rose from Q4 1997 until Q1 2000 but did so with increasing volatility, with huge corrections in October 1997 when the Asian crisis began, and August 1998, when Russia defaulted on its debt and the American hedge fund LTCM collapsed (Figure 11). 75bps of post-LTCM-meltdown Fed rate cuts extended the expansion and fueled a huge tech bubble that sent the NASDAQ 100 soaring 102% in 1999. 175bps of Fed tightening from mid-1999 until early 2000 popped the bubble and sent the S&P 500 down 50% by 2002 and while the NASDAQ 100 fell by nearly 85%. Overall, and in sharp contrast to bonds, stocks had negative information ratios for this period. Unlike 1990, they weren’t coming into winter undervalued. Meanwhile, fixed income investors did well with those at the short-end of the curve generating the best risk-adjusted performance. Fixed income was a great investment during this “winter” especially at the short-end of the curve.
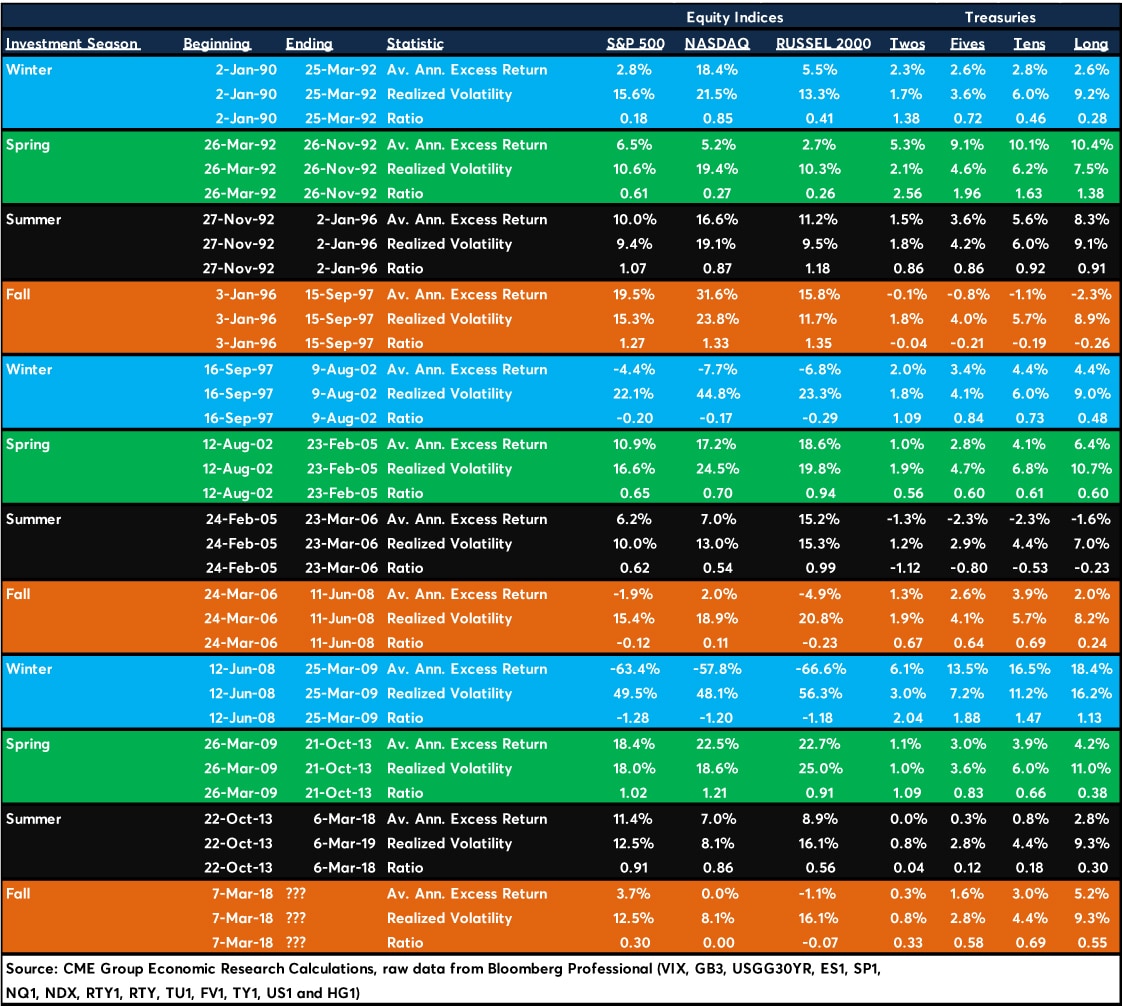
Figure 10: The Details.
Figure 11: Volatility Rose Years in Advance of the Peak in 2000 as the ‘90s Bull Market Became Erratic.
“Spring” 2002-05: The Fed’s 550bps of rate cuts from 6.5% to 1% worked their magic and fueled a spring time housing bubble that supported consumer spending and equities. 3M30Y’s 2Y moving average crossed above 200bps on August 9, 2002 and the VIX’s 2Y moving average stayed above 16% until February 23, 2005. Equities delivered solid performance with information ratios of 0.65-0.94, depending on the index. Bonds also did well, despite the Fed inaugurating a tightening cycle in late June 2004. Fixed income investors got a boost from extremely steep yield curves with great interest rate carry and rolldown as well as copious central bank buying for U.S. Treasuries that led the long-end of the curve to rally even as the Fed was raising short-term interest rates (the so called “conundrum”).
“Summer” 2005-06: The VIX’s 2Y moving average slipped below 16% on February 24, 2005 and the 3M30Y 2Y moving average stayed above 200bps until March 23, 2006. During this brief investment summer, equities continued to perform with information ratios of between 0.5 and 1 but bond investors suffered as the Fed hiked rates all the way back to 5.25% and brought the yield curve to flat. Short-term fixed income information ratios were below -1 but long-term bonds held up better with the continued expansion of central bank reserves.
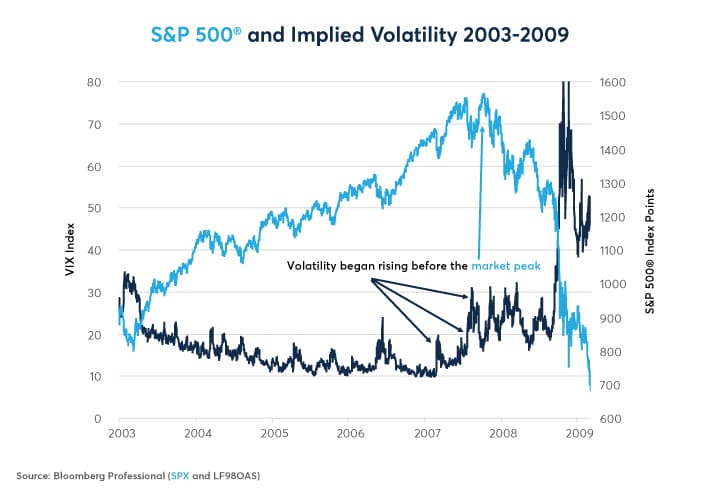
“Fall” 2006-07: On March 24, 2006, 3M30Y’s 2Y moving average slipped below 200bps but options markets were preternaturally calm in the face of the oncoming financial winter. In May 2006, the markets had a brief scare over the solvency of General Motors but then went back to sleep. In February 2007, the first real signs of subprime problems emerged at a Bear Stearns investment fund. A liquidity crisis began in July 2007. Yet the stock market rallied right up until October 2007 and even in early 2008 after Bear Stearns collapsed (to be rescued at a fire sale price by JPMorgan), the markets didn’t seem too perturbed. Overall, equities delivered a slightly negative return and 2Y through 10Y Treasuries had a respectable but not spectacular performance, hindered perhaps by a very flat yield curve. Notice though how a pattern of higher lows in the VIX anticipated the equity peak (Figure 12).
Figure 12: Notice how volatility began rising in advance of the market’s peak
“Winter” 2008-09: brief, brutal and so memorable we don’t have discuss what happened in detail. The VIX’s 2Y moving average crossed above 16% on June 12, 2008 and 3M30Y’s 2Y moving average remained below 200bps until March 25, 2009. During this nine-month period, stocks fell by 60% and bonds went through the roof as the Fed cut rates to 0.125%. As usual in investment winters, the short-end of the curve outperformed, with 2Y Treasuries generating a 2.13 information ratio during this nine-month period, outpacing bonds further up the curve.
“Spring” 09-13: the exceptionally harsh financial winter gave way to a long and turbulent spring as 3M30Y’s 2Y moving average crossed back above 200bps on March 26, 2009 while the VIX’s 2Y moving average stayed above 16% until October 21, 2013. With the economy rebounding and the Fed doing multiple rounds of quantitative easing (QE), equities soared. Fixed income also did well, supported by QE and by an exceptionally steep yield curve.
“Summer” 13-18: The VIX’s 2Y moving average finally fell below 16% on October 22, 2013 while the 3M30Y yield curve’s 2Y moving average stayed above 200bps until March 6, 2018. Large cap and tech stocks delivered a solid performance while small caps trailed. Bond returns were pretty flat, especially at the short-end of the curve. A collapse in oil prices in 2014-16 and the U.S. elections in 2016 added some excitement to an otherwise boring period for investors.
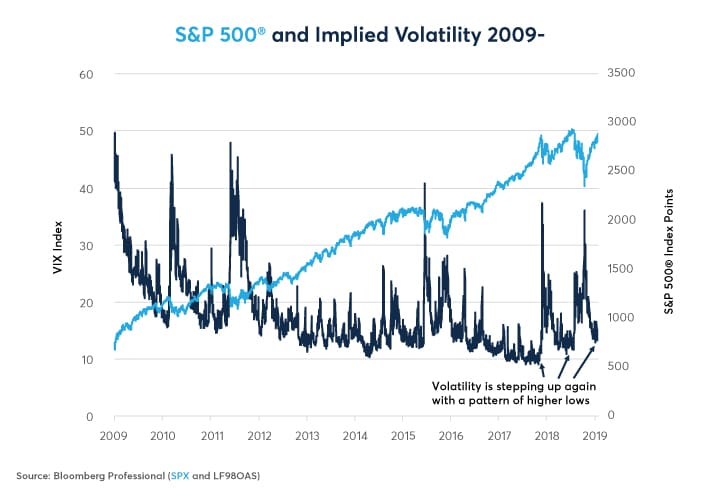
“Fall” 2018- : 3M30Y’s 2Y moving average slipped below 200bps in March 7, 2018 while the VIX remained low. Currently, its moving average and actual level are both around 13%. Equities have been choppy: euphoric in Q3 2018, in despair in Q4 2018 and euphoric again in Q1 2019 as the Fed went on hold. Bonds have delivered solid risk-adjusted returns, especially further up the curve as term spreads flattened. Volatility appears to be stepping up as it did in 2007 with each new high in stocks coinciding with a higher low in the VIX – an ominous sign (Figures 13). That said, if the Fed cuts rates, as Fed funds futures currently predict, the fall could be extended for a long while. “Spring” and “summer” each lasted four to five years, so why couldn’t fall extend well into 2020 or even 2021? By contrast, the Fed could also refuse to cut rates or even raise rates further as their dot plot continues to insist, in which case we too might soon be saying, “Winter is here.”
Figure 13: Is the Uptrend at VIX Lows a Sign That “Winter is Coming”?
Bottom Line
- The Fed may have overtightened monetary policy.
- The economic cycle may be gradually turning towards a wintry downturn.
- In past “winters,” equities have usually underperformed.
- Short-term bonds could soar because of the Fed’s policies.
- If the Fed doesn’t ease policy soon, brace for a surge in volatility.
Options to Mitigate Risk
Options on futures can help you mitigate risk in all the major asset classes, and diversify your portfolio. Get acquainted with the fundamentals, strategies and vernacular of options markets and benefit from the opportunities.