Single-Asset Class Tools
Dig into opportunities on specific CME Group markets you want to trade: run total cost analysis on futures vs. popular trading alternatives, view bitcoin pricing histories and more.
Use the Cross-Currency Basis Watch to determine the magnitude of EUR/USD cross-currency basis for short-dated periods and forward-starting IMM periods.
Explore the CME SOFRWatch Tool to learn how it can help you visualize the potential impacts of FOMC decisions on SOFR expectations.

Converts listed CME FX options premiums, fixed strike data, rules, and formats into an OTC-equivalent volatility surface, in OTC standard tenors, deltas, and quote conventions – creating comparable pricing across major options pairs.
The FX Swap Rate Monitor calculates the implied interest rate differential for eight currency pairs using tradable pricing data from CME FX futures and the FX Link central limit order book.

Explore the market's view of S&P 500 expected dividends on a quarterly and annual basis. Then analyze changes in dividend term structure across multiple points in time.
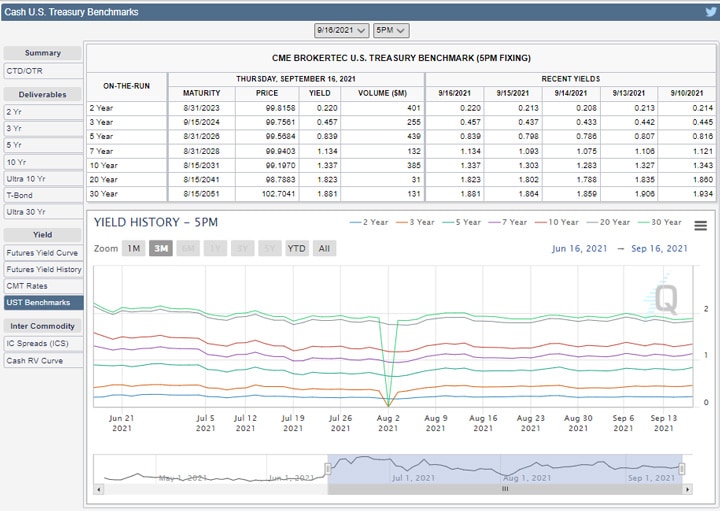
Gain an in-depth view into world's most secure and liquid government debt market. View futures vs. cash yields, track Treasury auctions and coupon issuance by tenor, chart the Fed's balance sheet composition.
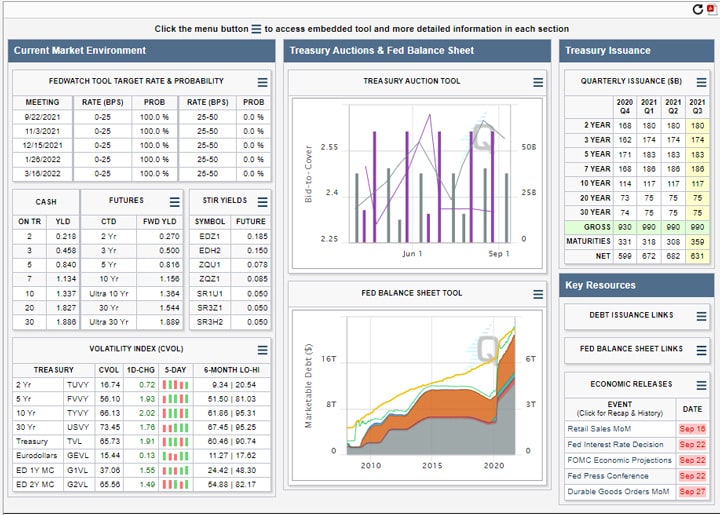
View historical fixings for EFFR and SOFR, and analyze basis spreads between Eurodollars, Fed Funds, and SOFR futures.
Analyze deliverable baskets, implied yields for CTD, strike as yield, and Treasury futures yield curve/history.
Analyze the all-in costs of managing interest rate exposure using listed futures versus over-the-counter (OTC) instruments like swaps.
Backtest your bitcoin trading strategies using bitcoin historical prices as tracked by the CME CF Bitcoin Real Time Index (BRTI) and CME CF Bitcoin Reference Rate (BRR) indicators.

Analyze the all-in costs of replicating S&P 500 exposure using equity index futures versus exchange-traded funds (ETFs) to see the more cost-efficient choice.
Browse More QuikStrike Tools
Find more insights from our full suite of QuikStrike tools to help you build and refine your trading strategies.
© 2026 CME Group Inc. All rights reserved.