Volume & Open Interest Tools
With these QuikStrike tools, see which strikes and expirations are the most traded, get daily market snapshots, view open positions by customer type and time frame, and track trading changes over time.
Track intraday and weekly rolling contract statistics (such as volatility, risk reversal prices, open interest, put/call ratios, and more), and compare them to the prior week.
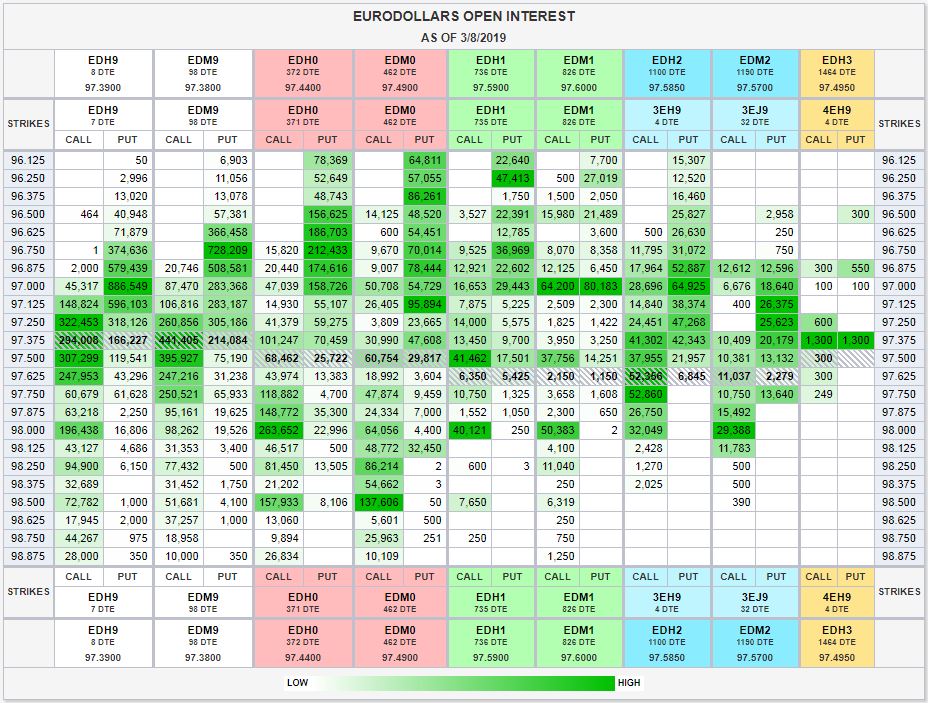
See instantly which option calls and puts have the most trading, by strike and expiration, and compare vs. the last day/week/month, to help you plan.
See what is hot now by viewing volume, open interest, and open interest change activity on the most active strikes, by calls, puts, and combined calls and puts.
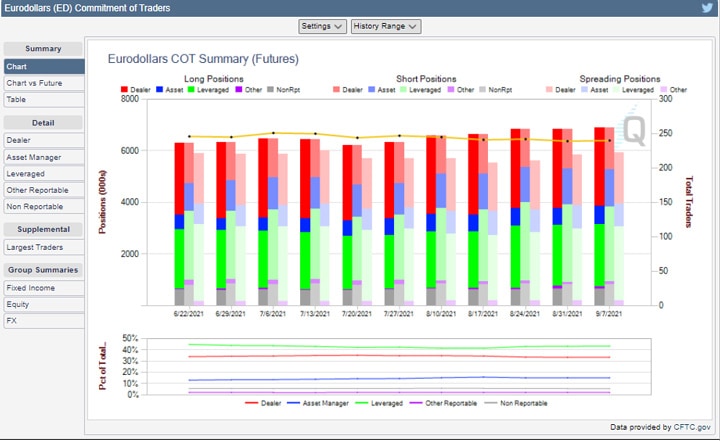
Drawn from data on the CFTC report of the same name, see which trader types have positions in a market you want to trade, at what size, whether they’re long or short, and chart changes over time.
View a daily snapshot of our weekly options complex, including volume, open interest and open interest change.
Analyze open interest and open interest change patterns for each expiration within the selected product.
Browse More QuikStrike Tools
Find more insights from our full suite of QuikStrike tools to help you build and refine your trading strategies.


