Oil: Three Signs of Prices Hitting Bottom
Oil prices have fallen out of bed again, with WTI crude oil tumbling 24% between April 23 and June 5. Refined products experienced similar declines, with gasoline and ultra-low sulfur diesel off 21% and 18%, respectively, over the same period. Not even attacks on shipping through the Strait of Hormuz appear to be enough to spark a sustained rally in either crude oil or refined markets.
In April, when oil prices hit their high for the year, three factors gave warning signals that a decline was becoming more likely:
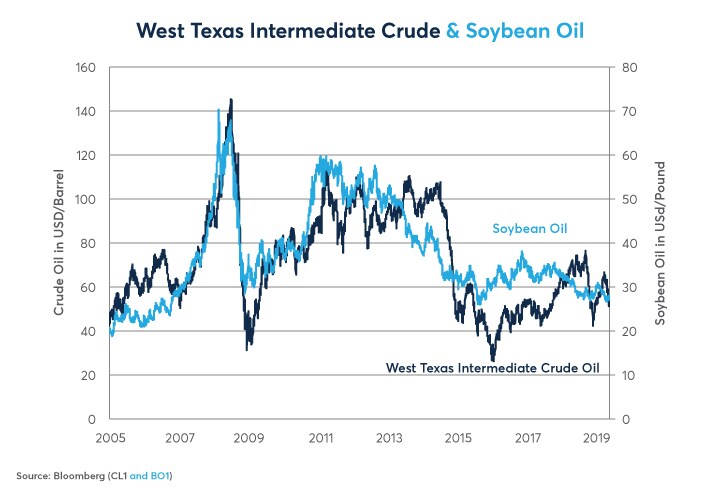
- Soybean oil prices, often a leading indicator of crude, had been falling for months (Figure 1).
- Out-of-the-money (OTM) crude oil options skewness became less negative than usual.
- OTM options on refined products had achieved extreme positive skewness.
Figure 1: Soybean Oil Prices Often Lead Crude Oil Prices.
Let’s begin with soybean oil. Soybean oil prices hit bottom on November 26, 2018, nearly one month before crude oil hit bottom. The subsequent rally in soybean oil presaged crude oil’s 57% advance between December 24 and April 23. Soybean oil prices peaked on February 7 this year and began a 15.5% decline that hit bottom (so far) on May 13. A few months later, crude oil followed suit. If soybean oil prices continue to advance, it might be an indicator of a near-term bottom in crude and refined product prices. For the past 15 years, soybean oil prices have often led the movement of WTI and other energy benchmarks, albeit with variable lags, for reasons that probably have to do with biofuel mandates and the relative size of the crude oil and vegetable oil markets.
Our related content:
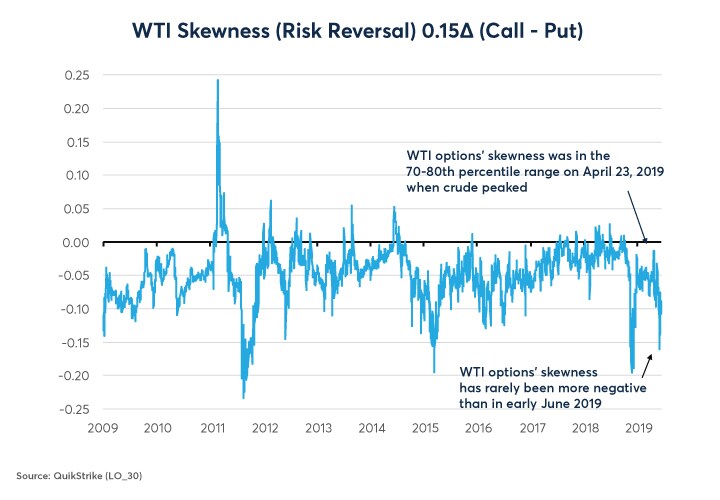
The other set of factors that oil traders might want to pay attention to are options prices, and most importantly the skewness of options. Over the past decade, the skewness (also called risk reversal) of crude oil options has been a contrary indicator of price direction over the next several months. Extreme negative skewness (OTM puts unusually expensive compared to OTM calls) often indicate a high likelihood of a rebound in crude oil prices. By contrast, extreme positive skewness (OTM calls relatively expensive compared to OTM puts) often indicate a period of negative performance on the horizon. This relationship holds even more strongly for refined products.
Our related content:
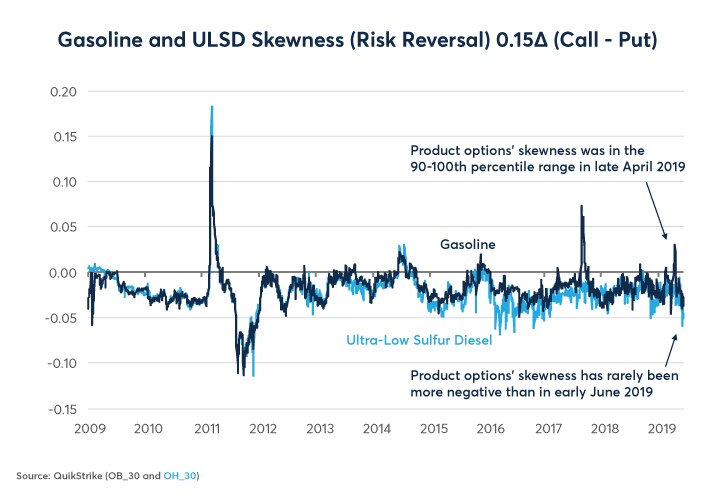
On April 23, when oil and refined products neared their peaks, call options had become abnormally expensive relative to put options. On that date, WTI options were in the 70-80% percentile range of skewness, meaning that only about one quarter of the time during the previous two years had OTM calls been more expensive relative to OTM puts. For refined products, it was even more extreme with OTM calls in the 90-100% percentile range of costliness compared to OTM puts relative to their previous two years of history (Figure 2 and 3).
Figure 2: Extreme Downside Skewness in Crude Options is Often a Positive Signal Going Forward.
Figure 3: The Skewness of Production Options is Often a Strong Contrary Indicator.
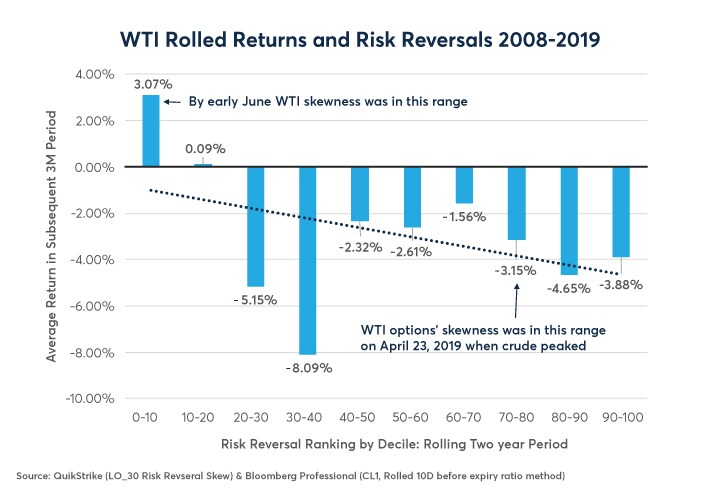
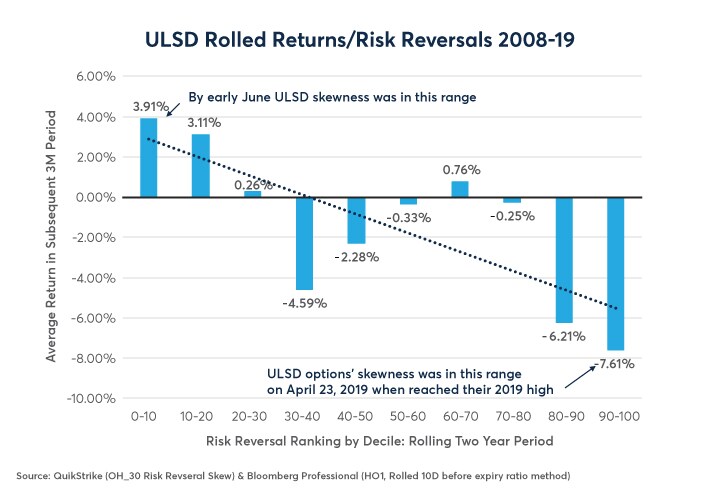
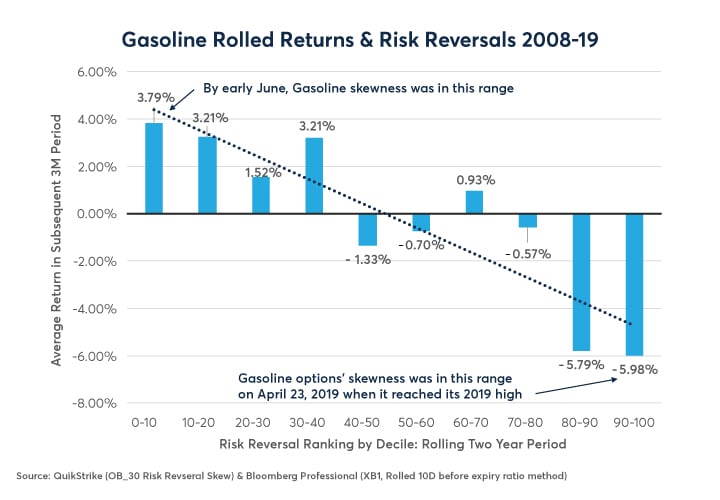
So where are we now? Since June 5 the options on crude oil and refined products have been the most negatively skewed that we have seen during the past two years, except for the bottom in December. It’s a similar story in the refined product markets. If history is any guide (and be warned: it’s not always a reliable one), that would indicate a significant likelihood of somewhat above-average returns for the crude oil and refined products markets over the next three months or so (Figure 4, 5 and 6).
Figure 4: On Average WTI Returns Have Been Best When Skewness is the Most Negative.
Figure 5: USLD Skewness and Subsequent Market Returns.
Figure 6: Exceptionally Negative Skewness in Gasoline is Often a Positive Signal.
In the meantime, economics remain unfavorable to oil prices:
- U.S. production is continuing to surge, recently hitting 12.4 million barrels per day.
- Inventories are rising.
- Slowing growth in the EU, US and China threatens to put a damper on oil demand.
- Growth appears to be stumbling in many emerging markets.
Political tensions in the Persian Gulf, however, remain a significant upside risk for oil prices and for the prices of refined products. Plus, after falling by nearly 25% in less than two months, much of the bad news for oil may already be priced in.
Bottom Line
- Soybean oil, crude oil options skewness correctly signaled the recent decline in oil prices.
- Both indicators are now pointing towards a stabilization of WTI and refined products.
- The degree of options skewness has often been a decent contrary indicator for WTI.
- Options skewness has been an even better indicator for refined products.
- Macro fundamentals remain bearish for oil, but political risks contain plenty of upside.
Oil Futures and Options
Mitigate risk during the summer driving season with energy futures and option by accessing the world’s benchmark options for Crude Oil, Natural Gas and Refined products around the clock.