Energy Options Skews: Beyond Supply Shocks
If one reads news coverage of the global crude oil and oil products markets, one might imagine that risks to oil prices are skewed dramatically to the upside. Indeed, among oil consumers – and that’s all of us—the main concern is supply disruptions, as driven home by the 1970s oil shocks, Iraq’s 1990 invasion of Kuwait, and consequences of the Arab Spring in 2011. As such, casual observers of the oil markets might be surprised to discover that during the past decade, out-of-the-money (OTM) put options were more expensive than OTM calls 92.5% of the time for crude oil and around 89% of the time for products such as Ultra-Low Sulfur Diesel (ULSD, formerly heating oil) and gasoline. In other words, oil traders have spent much more time during the past decade worried about downside risks than prices heading higher (Figures 1 and 2). Moreover, it turns out that the degree of skewness in the options markets has often been a good contrary indicator of where prices are heading, especially for the product markets.
Figure 1: Since January 2009, WTI Options Have Been Negatively Skewed 92.5% of the Time.
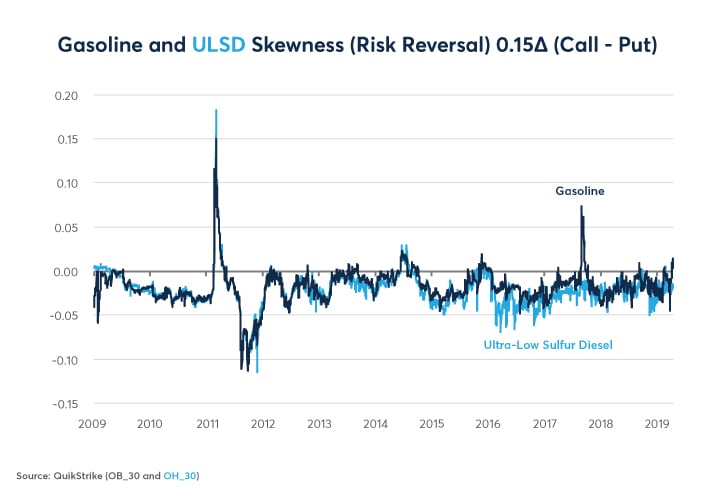
Figure 2: Oil Product Options Have Had Negative Skewness 89% of the Time Since January 2009.
Our related articles:
These related articles coming soon:
- Ag Options Skews
- Metals Options Skews
The persistent downside skewness (also known as “risk reversal”) of energy options during the past decade may have something to do with the unique circumstance of soaring U.S. energy production since 2008 (Figure 3). Had it not been for the 130% rise in U.S. production due to the shale oil revolution, the probability distribution surrounding the future evolution of oil market returns might have been more evenly balanced or even positively skewed. Nevertheless, as the US became the swing producer of energy, downside risks for energy increased as was notably the case during the November 2014-February 2016 collapse in oil prices. Unfortunately, we don’t have good data on oil options skewness prior to August 2008, so it’s difficult to evaluate how much the rise in U.S. production influenced options skewness.
Figure 3: Would Oil Options Have Shown Downside Skew if not for the Rise in U.S. production?
Skewness isn’t consistent over time. Sometimes the energy markets do show positive skewness as they did in early 2011 when the Arab Spring threatened to disrupt oil supplies and in fact took a large portion of the Libyan, Syrian and Yemeni oil off the market. At other times, notably in late 2011, as well as in 2015-16 and in December 2018, the skew became extremely negative. So, was positive skewness a sign that prices were about to head higher or a sign that oil was overextended to the upside and about to correct? Likewise, was extreme negative skewness a sign of further downside to come or a signal that energy markets were oversold and were about to stage a rally?
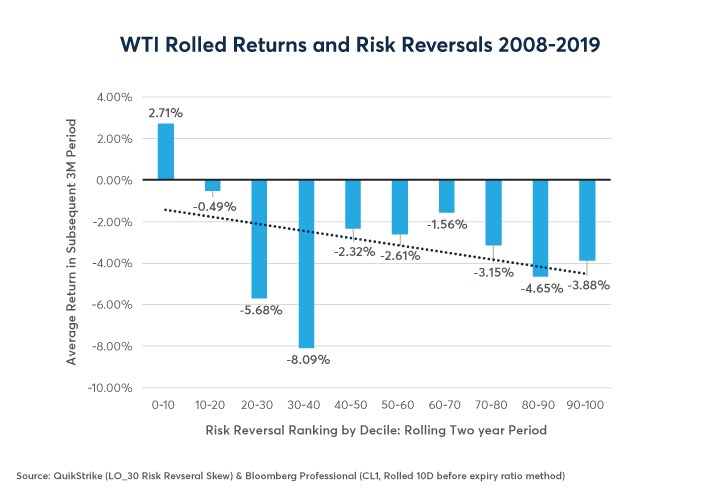
To answer these questions, we indexed the skewness on a scale of 0-100 over rolling two-year periods and compared it to the actual payoff of a fully funded long futures position in the various energy contracts over the subsequent three months (so there’s no look-ahead bias). For example, if the crude option skewness was the most negatively skewed to the downside it had been during the previous two years, the index would have a reading of zero. If the crude options market was the most positively skewed that it had been during the past two years, the index would have a reading of 100. We then broke the results down into deciles and looked at the subsequent three-month performance of the reinvested future rolled 10 days prior to expiry from 2008 until early 2019.
Crude oil options have shown a modest negative correlation with future returns in oil prices. However, in the three instances in which crude options became extremely negatively skewed (late 2011, early 2015 and late 2018), oil prices staged a substantial rally in the subsequent three-month period (Figure 4). That said, more modest negative skewness sometimes coincided with steep falls in prices afterwards. One might wonder why the returns on oil are generally so negative. That is because the oil market spent most of the past decade in contango (prices further in the future exceeded those nearer to the current contract month), giving it a strongly negative roll yield. Overtime, this negative roll yield has led to a substantial divergence between the theoretical return of the spot price of oil and the actual return of rolled futures positions (Figure 5).
Figure 4: Crude Oil Has Performed Best After Periods of Extreme Negative Options Skewness.
Figure 5: The Actual Rolled Return of Crude Oil is Much Lower Than the Evolution of Spot Prices.
For product markets such as ULSD and gasoline, the correlation has been much stronger. A more-than-average negative skew has often correlated with subsequent rallies in the prices of energy products, whereas more positive-than-average skew has often been followed by declining product prices (Figures 6 and 7). As such, even if one isn’t trading options and is focused only the futures themselves, knowing the degree of OTM call – OTM put skewness might be a useful indicator to observe. That said, like any such analysis, this one is backward looking and time sensitive, concerning only the period from August 2008 until April 2019. Investors shouldn’t expect that such relationships will necessarily hold going forward.
Figure 6: Extreme Negative and Positive Skewness Has Been Contrary Indicators for ULSD.
Figure 7: Skewness Has Been a Strong, Contrary Indicator for Future Changes in Gasoline Prices.
Bottom Line
- Energy options markets have been negatively skewed for most of the past decade.
- Traders have been more concerned with potential downside risks than with supply disruptions.
- Extreme negative skewness was a buy signal for crude oil during the past decade.
- Skewness was an even stronger contrary indicator for products such as ULSD and gasoline.
WTI Futures and Options
NYMEX WTI Light Sweet Crude Oil futures and options offer the most efficient way to trade today’s complex global oil markets wherever you are located. The market is highly liquid across all time zones.