Think Tank Points to U.S. Growth Slowing
Anxious about U.S. economic growth? The Conference Board’s Index of Leading Economic Indicators (LEI) has an excellent track record in forecasting the health of the economy. Even better than the LEI itself are the ratios of the LEI over the Coincident Index (Lead/Coincident) and Lagging Index (Lead/Lag). Changes in the ratios of these indices have presaged changes in GDP and unemployment with remarkable consistency over the past 60 years (Figures 1-4).
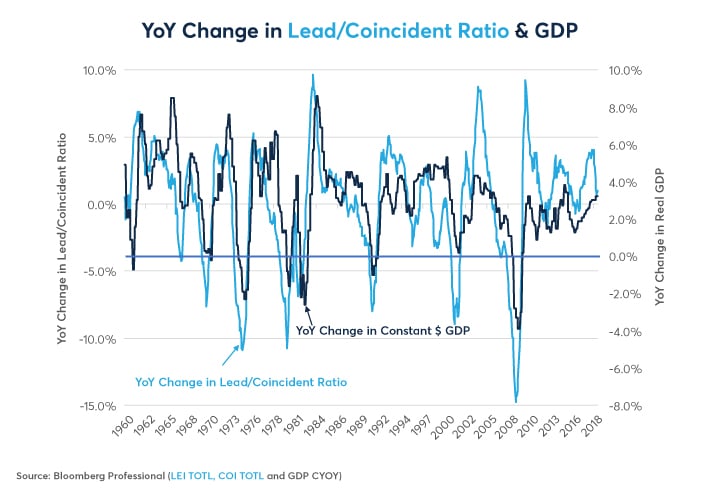
Figure 1: Changes in the Ratio Tend to Lead Change in GDP by 1-2 Quarters on Average.
Figure 2: GDP Follows the Lead-Lag Ratio About 3-6 Months Later.
The LEI has recently stagnated while the coincident and lagging indices have continued to advance, causing the ratio to fall slightly. This suggests that U.S. economic growth is about to slow to a pace of around 1.5%-2.0% while the unemployment rate might either edge lower or stabilize at current levels.
Figure 3: Steep Falls in the Lead/Coincident Ratio Often Mean Layoffs in the Next 6-9 Months.
.jpg)
Figure 4: If the Leading/Lagging Ratio Is Not Falling Substantially, Employment Usually Keeps Growing.
If you’re worried about a recession, the simple message is: don’t sweat it. Usually, the Lead/Lag ratio has to register about a 5% year-on-year decline or Lead/Coincident ratio needs to register about a 4.0% year-on-year decline before a recession becomes likely. That hasn’t happened yet but since the indicators’ last reading (March 2019), there are signs that the ratios are about to decline further. Among the various leading indicators in the ratio’s numerator (Figure 5), ISM New Orders slowed sharply in April (51.7 versus 57.1 in March). By contrast, non-farm payrolls, a coincident indicator in the denominator of the ratio, continued to advance strongly. Moreover, the yield curve remains relatively flat and this will detract from the growth of the LEI relative to the coincident and lagging indicators, putting downward pressure on the ratios going forward.
Figure 5: Meet (or Become Reacquainted With) the Leading, Coincident and Lagging Indicators.
|
Leading Indicators Average Workweek [text-align: left] |
Coincident Indicators Non-Farm Payrolls [text-align: center] |
Lagging Indicators Duration of Unemployment [text-align: center] |
| Source: The Conference Board | ||
As such, while there are no imminent signs yet of a downturn, keep an eye on the LEI and its ratio to the coincident and lagging indicators to see which way things are headed. If the LEI/coincident and LEI/lagging indicators go into free fall, as they did during the summer of 2007, it might be time to batten down the hatches. For the moment, however, they simply suggest a slowdown in GDP growth to close to its post-crisis average pace.
Bottom Line
- Ratios of Leading to Coincident and Leading to Lagging indicators do an excellent job of forecasting changes in GDP and unemployment.
- These ratios point towards a slowdown in growth and not a downturn.
- If the ratios deteriorate further, it may finally be time to sound the alarm.
- One can watch the individual components instead of waiting for the entire index to come out.
Interest Rate Options
Interest Rate options give you the liquidity and flexibility to manage risk efficiently across the entire U.S. dollar-denominated yield curve. With 2.4 million contracts traded daily in 2018, and 140 contract expirations listed at any time across Treasuries and Eurodollars, you are in the driver's seat.