Why Smart Money Trades Spreads Part IV
Spreading Gold and Silver
Part IV
When it comes to spreading in commodity futures the precious and industrial metals complex offers traders ample opportunities. Over the years, active traders have expressed great interest in the price of Gold and Silver and in recent years in Platinum and Palladium. In fact, palladium has had an incredible run in 2019 and now trades at a $350 premium to Gold and even greater premium to platinum.
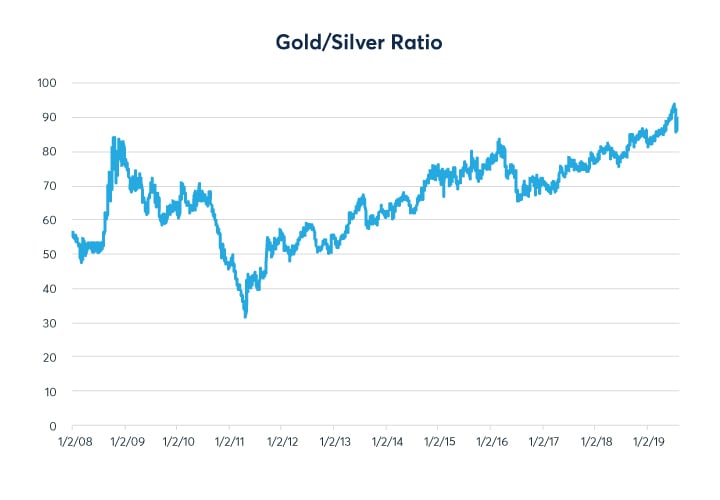
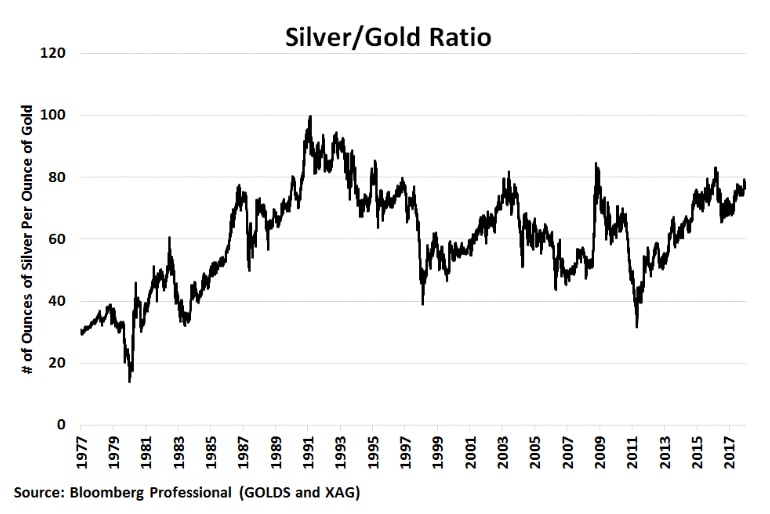
One strategy that has captured the attention of many traders large and small is the Gold/Silver spread (also known as Gold/Silver ratio). It is merely the number of ounces of silver required to buy one ounce of gold. One simply divides the price of gold by the price of silver to get the ratio. With gold trading at $1,515/oz and silver at $17.83/oz, the ratio currently stands at 84.97 (see figure 1 and 2 below). During Gold and Silver’s parabolic up-rise of the late 1970s, gold rallied to $875 an ounce while silver reached $50 an ounce—producing the lowest ratio since the late 1970s (17.5) Most of the last few years has seen it range bound between 45 and 90 (with a brief flirtation of 100).
Figure 1 Gold/Silver Ratio
Source: Bloomberg
Figure 2 Gold Silver Ratio over the Decades
The short and intermediate term trend has been toward the higher end of the range. While there are several causes for this, one of the major macro events was the massive secular decrease in silver usage in photography along with a decrease demand post financial crisis. With the advent of digital cameras and cameras built into mobile devices, the need for silver-based film has plunged! Only a small number of professionals and some in the medical field still use traditional film-based photography. Nearly all photography has been digitized contributing to a major drop in demand and thus massive price pressure on silver that doesn’t exist in the gold market.
However, the silver bugs and those that have traded the gold/silver ratio have a new macroeconomic tailwind thanks to increased demand for silver by technology. It’s a key element in computer chips, batteries, solar energy panels and other industrial uses. As the demand has soared since the turn of the century, silver has recovered some of its supply/demand equilibrium. Moreover, YTD Gold is up nearly 16% while silver is up about 15%. Earlier in 2019, as silver approached $20.00/oz, the ratio sunk below 80 for the first time since 2018. In figure 3 below, we ranked the gold/silver ratio over time (11 years) using percentile rankings to allow traders a bit more granularity into where the ratio stands vs. historical norms.
With the ratio currently at 85, it ranks in the 94th percentile, meaning that 94 percent of the time the ratio is lower. Hence, looking at the ratio from the standpoint of probability, it appears that silver has a good chance of outperforming gold. Remember though, just because the data reflect a 95th percentile reading doesn’t mean it can’t go higher. It could conceivably reach the 99th percentile. Probability and statistics are merely a tool for traders to help formulate a strategy. If the ratio were to come down to its average level over the past 11 years (66), the profit opportunity could be significant.
Figure 3: Gold/Silver Ratio Data Ranked by Percentiles
| Percentile Rank | Gold/Silver Ratio Level |
| High | 93.62 |
| 90th percentile | 81.00 |
| 75th percentile | 75.34 |
| 50th percentile | 66.95 |
| 25th percentile | 56.96 |
| 10th percentile | 51.31 |
| Low | 31.9 |
| Current Value | 85 (94th percentile) |
Data are for from 4/2008 to 8/2019
So, if a trader believed that silver was to outperform Gold in the near future, how does he/she structure the trade? By taking a quick look on cmegroup.com, traders can see the margins, the margin offsets and the clearinghouse recommended ratios for the spread trade. See illustration below for the strategy and margin calculations. By doing both legs of the trade at CME Group’s Comex division, the trader enjoys a 70% discount on the gross margins.
| December 28, 2019 | February 1, 2020 | P/L | |
| Long 1 Comex Silver futures | $17.80/oz | $20.00/oz | $2.20 x 5000 =$11,000 |
| Short 1 Comex Gold futures | $1,515/oz | $1,575/oz | $60 x100 = $6,000 |
| Gold/Silver Ratio | 85 | 79 | Total P/l = $5,000 |
| Margin Calculation | |||
| Long 1 Silver | $5,200 | ||
| Short 1 Gold futures | $4,500 | ||
| Gross Margin | $9,700 | ||
| Margin offset | 70% | ||
| Total Margin | $9,700 x (1-.7) = $2,910 |
Another caveat the trader should be aware of is the disparity in the contract sizes. Silver has a notional contract value of about $86,000 while gold has a notional value of $155,000 yet the clearinghouse maintains a 1 to 1 ratio. This may affect the profit and loss of the strategy. A trader could execute the strategy at a different ratio than 1 to 1—but they would not fully enjoy margin offsets.
Remember too, even though spreads generally have less risk, it is possible with commodities that both legs show a loss. Hence, the trader will have to have utilize pre-determined stops with this spread to minimize any losses that may arise.
Read More
Why Smart Money Trades Spreads - Part 1
Why Smart Money Trades Spreads - Part 2
Why Smart Money Trades Spreads - Part 3
QuikStrike®: Get the Insights You Need to Make Your Best Trades
Build and refine your trading strategies with free pricing and analytics tools for CME Group markets.