Why Smart Money Trades Spreads Part III
Spreading WTI Crude and Brent North Sea Crude
Part III
While there are hundreds of grades of crude oil in the world, two grades, West Texas Intermediate (WTI) and Brent North Sea Crude (Brent) are by far the two key benchmarks in the oil industry. WTI is produced in Texas and is generally the key benchmark for the North American markets. Brent comes from the North Sea region and is the key crude for Europe, Africa and other regions.
Brent and WTI are similar chemically (they have slightly different sulfur content and specific gravity measures) in that both are light sweet crudes—making them easier to refine. But it’s the supply and demand equation that differs for Brent and WTI. For years, the shale oil boom in the Permian basin near Texas saw large increases in production and thus supply relative to demand. This excess supply kept a lid on WTI prices relative to its Brent counterpart. In fact, WTI prices underperformed Brent for much of the last decade. The imbalance was so pronounced, that Brent once traded at nearly a $30 premium to WTI.
However, in recent years though, infrastructure improvements and the export of WTI to Europe and Asia has helped mop up some of the excess WTI supply contributing to a more normal supply and demand situation. Thus, WTI prices have gained relative to Brent prices in 2019. The changes in the price differential between the two benchmarks is the subject of widespread attention by refiners, producers and of course those that trade spreads in futures contracts.
Why focus on these two commodities?
- WTI Crude (CL) is incredibly liquid with the futures at CME Group trading over 1.2 million contracts per day and open interest eclipsing 2 million contracts.
- Brent Crude (BZ) has volume exceeding 100,000 contracts per day and open interest of 231,000 contracts.
- While the two contracts correlate very well, the changing supply/demand equilibrium creates shorter term price movements that traders can take advantage of
- If both legs of the spread are done at CME Group (Brent Trades at CME Group and other exchanges as well), traders may be eligible for margin offsets reducing capital costs.
- The spread between WTI and Brent is a simple 1:1 ratio and easy to execute.
How the Spread Works.
If the trader believed that Brent was going to outperform WTI, the trader might opt to go long Brent and Short WTI in a 1:1 ratio. Below is the margin calculation for this spread that considers the margin offsets afforded by CME Group’s clearinghouse for spreads where BOTH legs are done at CME. The margin offsets appear to be significant—a full 80% less than the gross margin of the two individual positions. See figure 1 below.
Figure 1
| Position Structure | Price | Margin on each leg |
| Long 1 March Brent (BZH20) | 66.58 USD/bbl | $4,100 |
| Short 1 March WTI (CLH20) | 60.68 USD/bbl | $3,700 |
| 5.90 spread Brent over WTI | $7,800 gross margin | |
| Margin Offset | 80% per clearinghouse | |
| Final Margin | $7,800 x (1-.80) = $1,560 |
If the trader believed that WTI would outperform Brent as it has since early 2019, then the trader might opt to reverse the position and go long WTI and short Brent in the same 1:1 ratio and may be able to have the same margin result.
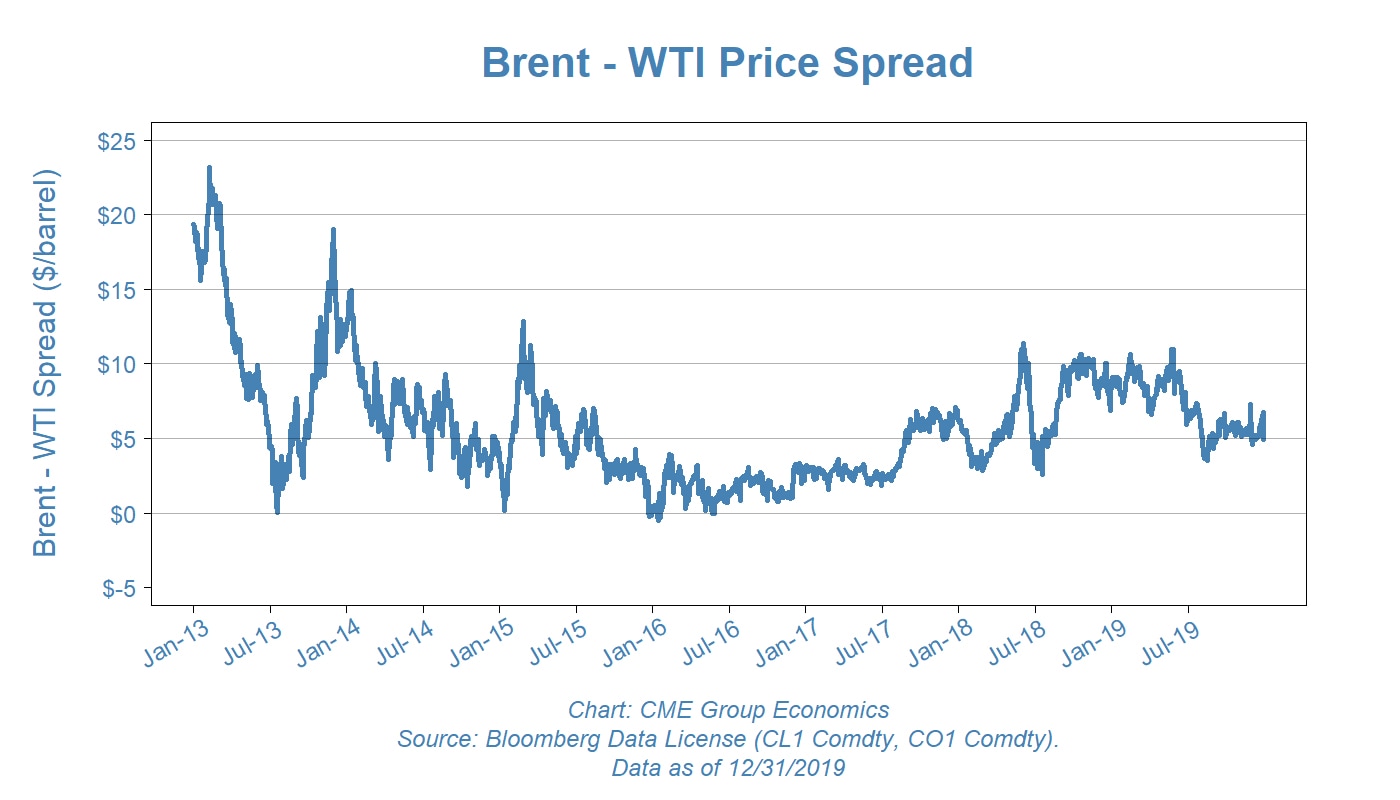
Figure 2 below shows the recent history of the spread. In 2012-13, Brent traded $30 higher than WTI because of a major oversupply of WTI in the United States. As mentioned earlier, massive changes in infrastructure and exportation of WTI contributed to a tightening of demand and strengthening of prices. The result was the slow but sure decline in the premium of Brent over WTI. As early as January 2010, Brent traded at a $10 premium to WTI but as the year progressed, the spread continued to show WTI price improvement relative to Brent. As of late December 2019, Brent’s premium over WTI is less than $6.00 a bbl but traded as low as $3.00!
Figure 2
Read More
Why Smart Money Trades Spreads - Part 1
Why Smart Money Trades Spreads - Part 2
Why Smart Money Trades Spreads - Part 4
QuikStrike®: Get the Insights You Need to Make Your Best Trades
Build and refine your trading strategies with free pricing and analytics tools for CME Group markets.