Treasury Curve Trading Surges in Q1 2020
Inter-Commodity Spreads (ICS) are pre-defined spreads between Treasury futures contracts listed on CME Globex. ICS allow market participants to execute Treasury curve trades in a single transaction, eliminating slippage risk that could occur when legging such a spread. ICS also offer automatic margin offsets, increased matching opportunities, and can reduce the noise of individual legs during volatile markets.
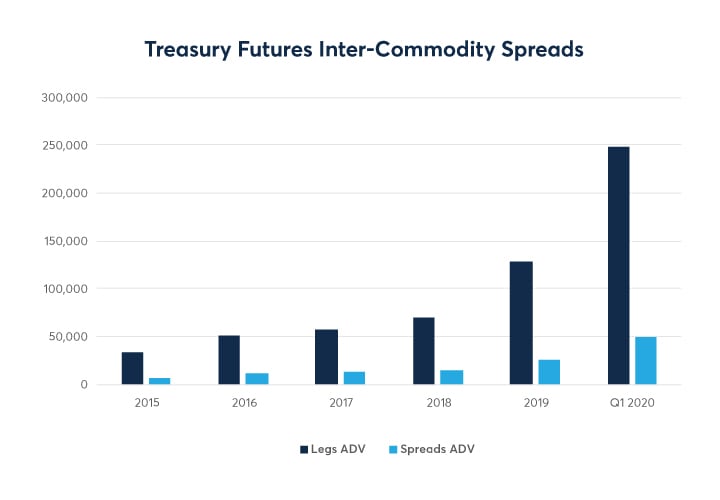
As an efficient tool for executing yield curve trades, Treasury ICS have seen marked growth in recent years. Following a record 2019, activity nearly doubled in Q1 as markets grappled with unprecedented volatility.
Q1 highlights
- Nearly 50K spread combinations traded daily in Q1, +99% vs 2019, resulting in a quarter million contracts per day in leg volume
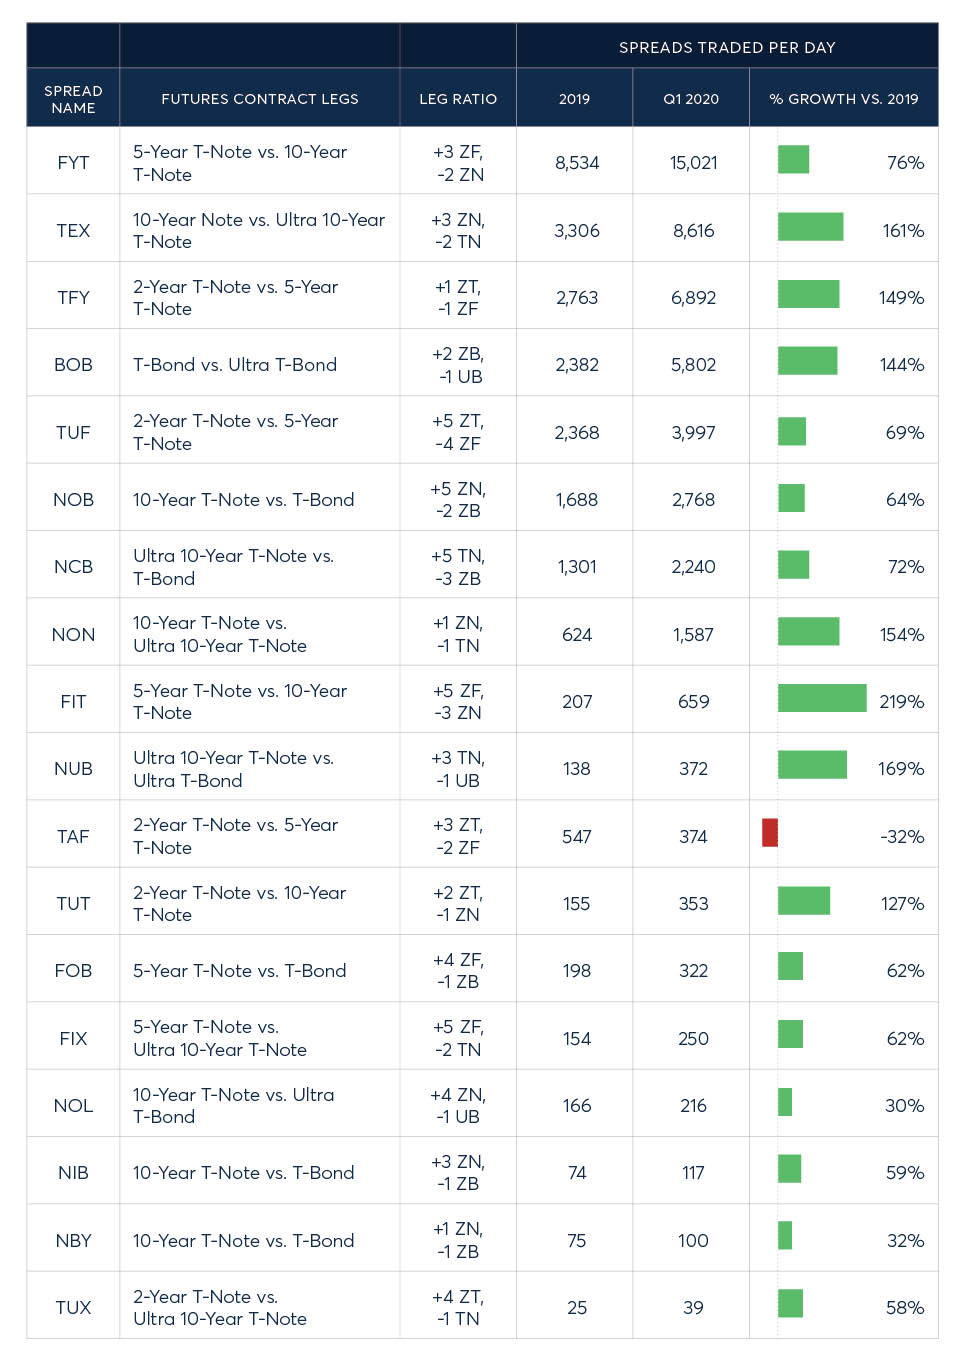
- FYT (+3 ZF, -2 ZN) remains the most actively traded ICS
- Biggest growth seen in FIT (+5 ZF, -3 ZN), NUB (+3 TN, -1 UB), and TEX (+3 ZN, -2 TN)
Q1 activity by spread
Product Code Legend: 2-Year (ZT), 5-Year (ZF), 10-Year (ZN), Ultra 10-year (TN), T-Bond (ZB), Ultra T-Bond (UB)
About Treasury Inter-Commodity Spreads
Mechanics and pricing
- “Buying the spread” refers to buying the front leg and selling the second leg (a steepener)
- Spreads trade in exchange-defined ratios.
- The front leg is the contract with the shorter maturity.
- Quantity ratios are established quarterly based on futures DV01 using the respective cheapest-to–deliver securities. Ratios are expected to remain unchanged throughout the contract’s listing cycle.
- Price ratios equal the front leg quantity divided by the deferred leg quantity. The price ratio of spreads that include 2-Year T-Note is doubled to account for its notional size ($200,000) is twice that of the other Treasury futures contracts
- Minimum spread tick is equal to that of the minimum tick of the front leg of the spread.
- Components of the spread trade have the same expiration month and year:
- June 2020 5-Yr T-Note vs. June 2020 10-Yr T-Note
- External name: FYT 03-02 M0
- Quantity Ratio: 3:2 Price Ratio = 1.5000
- Pricing convention is “net change on day”, see pricing example below for an illustration.
Listing and trading
- Deferred month spreads will be listed midway through the month prior to a contract expiration month. For example, September ICS will be listed in mid-May, and will join the existing June spreads.
- All spreads are eligible to trade until expiration day of whichever leg expires first.
Order type specifications
- Good Till Cancelled (GTC) and Good Till Date (GTD) order qualifiers not supported.
- Spread type: IV
Matching
- Implied outrights created by ICS have FIFO priority.
- Defined spread orders will take precedence over implied orders at a given price.
Market data
- Generally, only 1st generation implied “in” market data is disseminated.
- Implied “out” prices on ICS legs are not disseminated.
- EXCEPTION: Implied “out” market will be displayed for spreads with 1:1 quantity ratios.
Trade matching process
If available, incoming ICS orders match with existing ICS orders at the required price. Otherwise, CME Globex will “leg” the spread order.
- The ICS matches with a resting ICS order at the same or better price.
- In these cases, leg prices are allocated such that net change in the front leg matches the net change of the spread price. The assigned price of the back leg matches the settlement price of the previous day (unchanged)
- If a match isn’t available in the spread book, CME Globex will look to the constituent leg prices to see if there is a potential match.
- In cases where Globex “legs” the order, the spread order will be executed at the most advantageous differential possible, which may be better than the price on the incoming order
- Significance: while ICS prices are disseminated and orders entered at “standard” (.25, .50, .75, 1.0) tick increments, ICS orders are frequently matched at bid/ask spreads narrower than “standard” tick increments
Treasury ICS pricing example
FYT 03-02 M0 (5-Year T-Note vs. 10-Year T-Note
- Quantity Ratio: 3:2 Spread
- Quantity: 200
- Price Ratio: 1.5000
| Prior-Day Settle Price | Current Price | Net Change | Leg Quantity | |
| FVM0 | 123-14.5 | 123-06 | -8.5 | 600 |
| TYM0 | 131-13 | 131-00 | -13 | 400 |
Spread Price = (-8.5) – (-13/1.5000) = 0.1667/32nd
How do I measure the profit/loss from this trade?
The dollar change in the spread from the previous day’s settlement price is equal to:
| Spread Price | x | $ Value of 1/32nd | x | # front leg contracts | = | P&L | |
| If the trade takes place on the bid price (0.00) | 0/32nd | x | $31.25 | x | 600 | = | $0.00 |
| If the trade takes place on the ask price (0.25) | 0.25/32nd | x | $31.25 | x | 600 | = | $4,687.50 |
A spread ratio to fit any need
CME Group lists multiple ratio options for each Treasury spread, allowing customers to choose the instrument best suited for their risk management or trading needs.
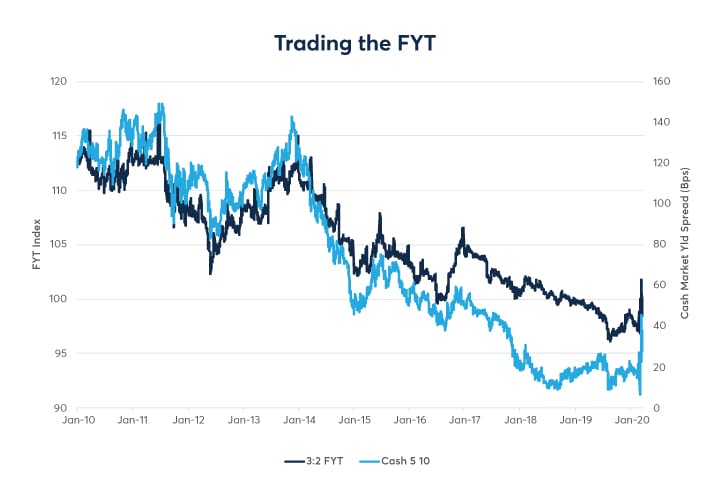
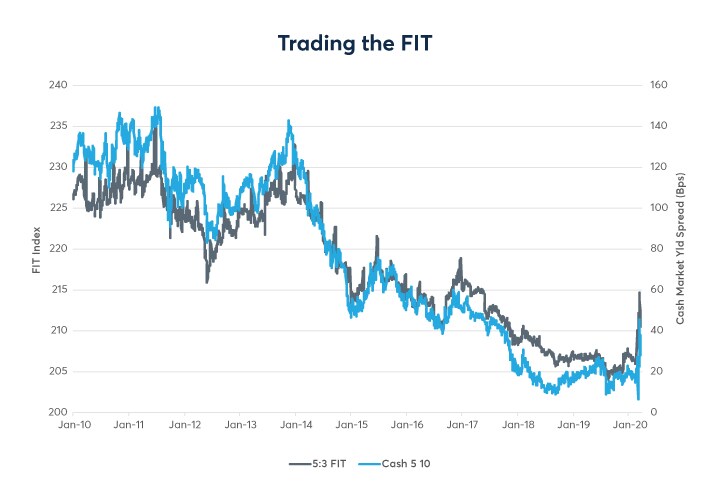
For example, for trading the popular 5s over 10s spread, users have two liquid instruments at their disposal. The 3:2 leg ratio FYT and the 5:3 leg ratio FIT. While FYT is the most actively traded ICS instrument, as shown below, the FIT’s 5:3 ratio has been a more precise DV01 proxy for trading the cash 5/10 spread in recent years.
https://www.cmegroup.com/content/dam/cmegroup/education/images/2020/treasury-curve-trading-q1-chart3-720x500.jpg https://www.cmegroup.com/content/dam/cmegroup/education/images/2020/treasury-curve-trading-q1-chart4-720x500.jpg
View our full ICS offering
Inter-Commodity spreads are available on Treasury futures, Short-Term Interest Rate futures and Eris Swap futures
Treasury ICS Analytics tool
For each Treasury ICS instrument, view the current price/leg spread ratio as well as its index value, yield spread, and hedge ratio for the prior settle and on an intra-day basis.