LNG: Stepping Up to the Asia Supply Boom
Recent Developments in Asia LNG Market
Natural gas exports are poised to see a sharp rise in 2016. Australia will be ramping up its production capacity over the next three years.1 The U.S. Gulf Coast exported its first cargo of Liquefied Natural Gas (LNG) in February. Against this supply scenario, however, Northeast Asia might see a fall in gas demand due to the substitution effect triggered by the collapse in oil prices.
Meanwhile, Singapore is gearing up to become a LNG hub in Asia. The Singapore government supported the launch of a LNG spot index in October 2015. This index is a FOB Singapore assessment, based on a virtual LNG cargo location in vicinity of Singapore.
In July 2015, the Chinese central government backed its municipal government’s plan to launch a physical spot LNG trading platform in Shanghai. Other Asian countries, including Japan, are also vying to develop regional trading hubs, so that LNG prices better reflect the market dynamics in Asia.
Putting Things in Perspective
Unlike Europe and America, an interconnected gas pipeline has not taken shape in Asia as it is not a single landmass. The biggest consumer of natural gas is the Northeast Asian region – comprising Japan, South Korea and Taiwan (and increasingly China). There is, therefore, a reliance on LNG tankers to ship gas to these destinations in Asia.
While China and Singapore may be at the forefront of news about Asia’s LNG sector, it is worth noting that Japan and South Korea consume 125 mtpa (55% of global LNG exports and 70% of all Asian imports).
China is poised to double its LNG imports to 40 mtpa by 2017,2 but this is still relatively modest. When reviewing the price discovery of Asian LNG, Japan and South Korea are the first ports of call.
There is Now Excess LNG Supply Globally
LNG is an important source of power and electricity generation in Japan. When Japan’s nuclear plants shut down from 2012 to 2014, domestic LNG demand rose significantly, and almost all available LNG was locked up in term contracts. Spot LNG accounted for less than 15% of the LNG-traded market.
However, with the economic slowdown in Asia last year, the amount of LNG in the form of already purchased contracts now exceeds actual demand.3 Hence, buyers locked into term-supply contracts are looking for ways to off-load their excess supply in the spot market.
Power and Gas Players Want to Lock-In Profits
Under Japanese Prime Minister Shinzo Abe’s “third arrow” of structural reform, domestic firms in Japan are encouraged to participate in the previously monopolized public utilities space, and to import LNG from the U.S. This has encouraged domestic power-generation players to look for more hedging tools to lock in their oil-gas spread, and for gas utilities to lock in their profit margins and the forward prices of gas.
More LNG in the Market Pricing Against Spot
In the past, long-term contracts would typically not permit cargo deliveries to be diverted. However, more “flexible” term contracts have become more prevalent in recent years.4 Flexible-contract cargoes may be re-traded, and some partial cargoes have become available for trading. Cargoes originally destined for Europe are frequently redirected to the Far East, and reselling of delivered cargoes is also taking place. Cargoes are re-traded multiple times.
This has a positive impact on the price discovery process, and is behind the rapid growth of Spot LNG, which now accounts for 30% of the traded market. According to price reporting agencies, there are daily bids and offers for physical cargoes nowadays.
You Want It? We Got It
CME Group offers a number of futures contracts to hedge the requirements in LNG. Some of these use established benchmarks on NYMEX such as Brent crude oil, Henry Hub natural gas and Platts JKM LNG contracts. And there is now the new RIM DES Japan LNG contract. The Dutch TTF LNG contract traded on CME Europe is also being used for U.S. exports from Cheniere Energy into Europe.
CME Group’s bespoke hedging solutions seek to cover exposure to the LNG market as it develops, whether this is directly in LNG or in the associated natural gas futures markets where established and liquid contracts are already trading. NYMEX aims to be the ‘go to’ exchange as LNG derivatives trading develops, providing hedging solutions to the LNG community.
About CME’s RIM DES Japan Contract
The launch of this new contract followed months of collaborative discussions at the highest level, involving CME Group Chairman Emeritus Leo Melamed and Japanese Prime Minister Shinzo Abe.5 CME Group signed a three-way partnership with RIM Intelligence (a price reporting agency) and JOE (Japan OTC Exchange). JOE is a joint venture between TOCOM (Tokyo Commodity Exchange) and energy brokerage Ginga, and is supported by the Japan’s Ministry of Economy, Trade and Industry (METI).
CME Group has exclusive rights to clear the LNG futures contract based on the RIM Index. Price discovery will take place on JOE, RIM will publish the assessment, and CME Clearing6 will provide the clearing.
The cargo delivery points for the contract ex-ship are ports in Japan and Northeast Asia -- which includes South Korea, Taiwan and China. The RIM assessment is based primarily on concluded deals and bids/offers in the DES Japan physical market and JOE LNG market.
RIM DES Japan Index is Robust
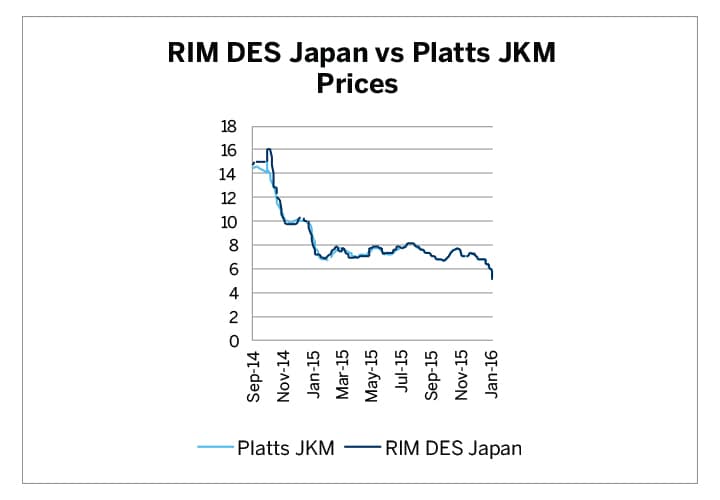
Platts publishes price assessments of the LNG market in the similar Northeast Asia region, referred to as the Platts JKM index. RIM Intelligence formally started maintaining historical price data for the LNG index in September 2014.
Even though the RIM DES Japan and Platts JKM cover similar regions, there are nevertheless some market participants that have specific exposure to the RIM index; hence the impetus for METI and CME Group to develop the contract.
We ran an analysis of the RIM DES Japan against the Platts JKM to determine the robustness of the RIM index. The analysis showed that the two series exhibited a linear correlation of 0.99 and an R-squared statistic of 0.98. This validated the robustness of the RIM index as a representation of the LNG prices delivered into Japan, despite its shorter data history.7
| RIM DES Japan vs Platts JKM Prices | |
| Linear Correlation | 0.99 |
| R2 Test Statistic | 0.98 |
Source: CME & RIM market data 2014 to 2016, CME estimates
Figure 1
Source: CME & RIM market data 2014 to 2016
Physical LNG flows into Asia
According to the United Nations’ Commodity Trade Statistics Database (Comtrade), and the International Gas Union’s World LNG Report 2015, 241 million metric tons of LNG were exported in 2014. 174 million metric tons or 72% of all LNG exports were bound for Asia, and 89 million metric tons or 51% of this Asia-bound LNG was imported by Japan alone.
The Asian LNG market is dominated by long-term contracts. Both developed countries (e.g. Japan) and developing countries (e.g. China) need to secure security of supply for their growing industrial demand. Producers want to secure their long-run returns on infrastructure investments.
NYMEX Brent for Hedging Term LNG Contracts
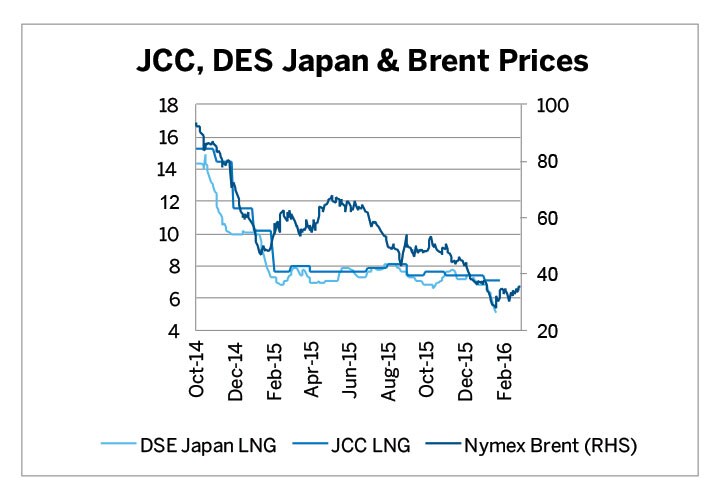
In the 1970s, Japan was the largest economy in Asia, and crude oil was the main competitor to gas in power generation. While the “Japan Crude Cocktail” (JCC) represents the average price for crude oil imports into Japan, the JCC index itself is commonly used as a reference price index for long-term LNG contracts in Japan. By the time South Korea and Taiwan became significant LNG importers in the late 1980s, the JCC index was already well established.
There are no derivatives contracts based on the JCC index. The Brent crude oil benchmark became the de-facto hedging tool against the JCC in the market. The NYMEX Brent futures contract is listed out to eight years and can be used for hedging against long term JCC-linked contracts.
Figure 2
Source: Petroleum Association of Japan, RIM, CME Group
Henry Hub also Making its Mark in Asia
After the March 2011 Fukushima earthquake, LNG prices in Japan increased as power generators switched from nuclear to gas feedstock. LNG prices in Japan surged to $15 in 2014. As LNG prices declined along with crude oil prices in 2015, the JCC-indexed prices started to diverge markedly from prices of physical LNG delivered into Japan.
Meanwhile, natural gas has become a unique commodity in its own right globally. The Henry Hub natural gas index is increasingly being used for term LNG contracts in Japan and South Korea. With Cheniere Energy pushing to link LNG to gas prices globally8, Henry Hub is likely to become an important pricing benchmark for LNG term contracts in Asia.
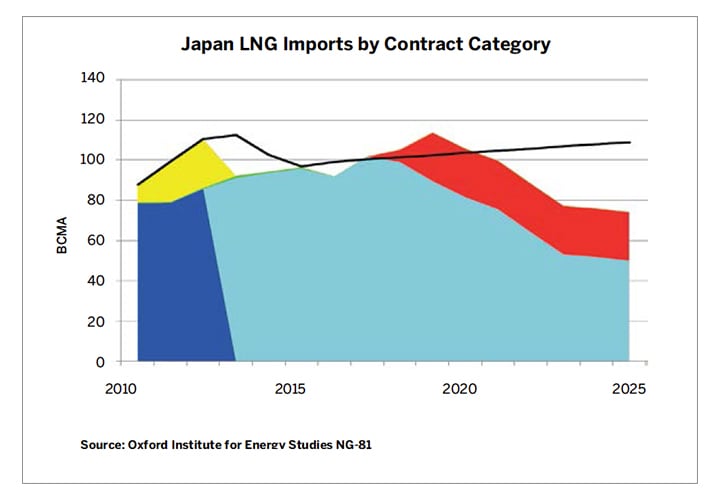
Pricing tools used in the LNG market are shown in the chart below. To summarize, long-term contracts in Northeast Asia are likely to remain priced off JCC9 (light blue, in chart below) and Henry Hub (red). Brent is the main hedging tool against JCC prices.
Since 2013, more LNG cash contracts have started to be priced off spot indexes. The number of LNG contracts traded on spot, or short-term, basis in Japan rose from less than 15% in 2013 (yellow + green in chart below) to over 30% in 2015. (The dark blue shows remnant legacy term contracts).
Figure 3
Source: Oxford Institute for Energy Studies NG-81
Several Spot LNG Indexes Being Developed
An estimated 40% of the spot and short-term contracts are currently priced off the Platts JKM index. Efforts are underway to develop alternative benchmarks to complement the Platts JKM. This includes current efforts in Singapore and China to develop regional spot LNG indexes.
In September 2014, the Japanese Ministry of Economy, Trade and Industry (METI developed a LNG NDF contract on its Japan Over-the-Counter Exchange (JOE), which is settled against the RIM Index.
METI was also keen to develop LNG futures on JOE, based on a DES physical mark. Hence, the efforts between METI, JOE and CME to enable the launch of the LNG DES Japan (RIM) futures contract (Code: JNG) on NYMEX on 21 February 2016.
OIES and EIA Studies Provide Some Insights
Why are so many LNG pricing benchmarks being developed in the market recently, especially at the Spot or short end of the forward curve?
To recapitulate, oil price linkage was introduced in the 1970s when oil was the main competing fuel to natural gas in Japanese power generation. But post-Fukushima, Japanese utilities began to suffer losses, due to the divergence between JCC-linked prices and physical LNG cargo prices.
The main question raised in the OIES2 study was whether the problem was that of price level or price formation – that is, are oil prices too high or the JCC is the not the appropriate mechanism for natural gas prices.
The study analyzed several alternative price formation mechanisms – Spot LNG Price Index such as the JKM, natural gas based pricing such as Henry Hub, and the potential for pricing at an Asian Hub.
Pricing Points – Delivery Ex-Ship vs Netback
The International Energy Agency (IEA) also weighed in with a report on the potential development of a natural gas trading hub in Asia. The IEA study1 recognized the diverse natural gas markets in the region, and highlighted the pros and cons of Japan, South Korea, China and Singapore as potential price discovery hubs in Asia.
To develop a spot LNG pricing point, the index technically does not need to be restricted to physical loading cargoes at specified destinations. The pricing mechanism could theoretically be a Netback price. A few such LNG index developments are in progress in Asian markets, and their methodologies may possibly be valid.
Anything that could bring a more transparent market for LNG spot trading in Asia would be welcome by market participants.
Nevertheless, LNG needs to be grounded in physical trades for a reliable forward curve to develop. This would be most directly represented by an index which is a Delivery Ex-Ship or DES pricing point.
There are Long Term and Short Term LNG Hedgers
There is a good diversity between those who have long and short exposures to the LNG market. Among traders who have physical positions which need to be hedged, the Shorts are typically the Japanese, South Korean and Taiwanese power and gas companies, and the Longs are typically project and infrastructure developers. Banks, trading houses, financiers and LNG ship owners also have financial exposures to LNG prices.
CME Group has the NYMEX Brent crude oil and Henry Hub natural gas futures contracts for hedging the longer end of the LNG term contracts. And the RIM DES Japan and Platts JKM LNG contracts for hedging the spot LNG contracts.
What is Going on in the Gas Market
Two LNG supply 'waves' are looming. Wave 1 is Australia ramping up production capacity. The forthcoming supply is completely pre-sold under long-term contracts, with 100% Take-or-Pay, and with destination restrictions.
Wave 2 is from the U.S. over the longer term. Cheniere Energy was recently authorized by the U.S. Department of Energy to export 514 billion cubic feet per year of natural gas for a 20-year term from its Stage 3 project facility. Construction will commence by 2017, with exports commencing as early as 2021.10
For now, the Asia LNG market prefers long-term hedging based on oil pricing. The establishment of potential LNG trading hubs in Asia might, however, foreshadow a market shift toward gas-based pricing over time.
Some market analysts believe that developments in the U.S. could influence the way natural gas is traded in the future. If so, a global spot market might develop in the future where LNG and gas prices might become globally linked.
Contract Specifications
| LNG DES Japan (RIM) Futures | |
| Popular Name | RIM DES Japan |
| Contract Code | JNG |
| Contract Unit | US Dollars per MMBtu |
| Contract Size | 10,000 MMBtu |
| Price (18 April 2016) | 4.70 |
| Average Daily Volume | n.a. |
| Open Interest | n.a. |
| Settlement | Cash settled against index |
| LNG Japan/Korea Marker (Platts) Futures | |
| Popular Name | Platts JKM |
| Contract Code | JKM |
| Contract Unit | US Dollars per MMBtu |
| Contract Size | 10,000 MMBtu |
| Price (18 April 2016) | 4.20 |
| Average Daily Volume | n.a. |
| Open Interest | n.a. |
| Settlement | Cash settled against index |
| Brent Last Day Financial Futures | |
| Popular Name | Nymex Brent |
| Contract Code | BZ |
| Contract Unit | US Dollars per barrel |
| Contract Size | 1,000 barrels |
| Price (18 April 2016) | 43.15 |
| Average Daily Volume | 113,000 |
| Open Interest | 173,000 |
| Settlement | Cash settled against index |
| Henry Hub Natural Gas Futures | |
| Popular Name | Henry Hub Nat Gas |
| Contract Code | NG |
| Contract Unit | US Dollars per MMBtu |
| Contract Size | 10,000 MMBtu |
| Price (18 April 2016) | 1.94 |
| Average Daily Volume | 300,000 |
| Open Interest | 1,040,000 |
| Settlement | Physically Deliverable |
References
[1] http://www.rba.gov.au/publications/bulletin/2015/mar/pdf/bu-0315-4.pdf
[2] China’s 12th Five Year Plan for Energy issued January 1, 2103
[3] http://www.reuters.com/article/lng-surplus-trade-idUSL3N12N2PV20151030
[5] https://www.fiajapan.org/site_newsletters/en/201409/FIAJ_Newsletter_EN_2014_09.pdf
[6] CME Group and Rim Intelligence sign exclusive license agreement for DES Japan LNG
[7] Log Return Correlation would not be appropriate as the prices may not change for a few cycles, and Log Return would have led to illogical results.
[8] https://www.cmegroup.com/cms/s/0/70931a66-5238-11e5-8642-453585f2cfcd.html#axzz44uYtSjsL
[9] https://www.eia.gov/todayinenergy/detail.cfm?id=23132
[10] http://uk.reuters.com/article/column-russell-lng-asia-idUKL3N10A1AK20150730
Recommended For You
View this article in PDF format.