Grains: Options Underpriced for La Nina Volatility?
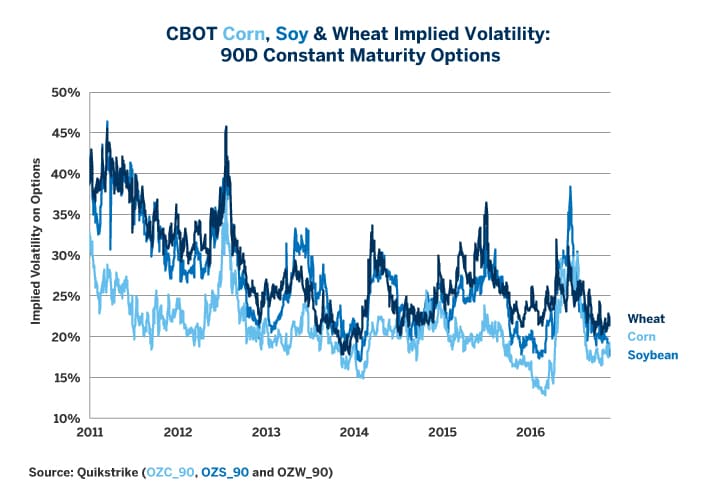
Donald Trump’s election as U.S. President rocked currency, bond, equity and metals markets but agricultural products barely took notice. Not only have corn, soy and wheat prices held their ground since, the cost of options are hovering near the low end of historical ranges (Figure 1). The lack of any movement in prices could be due to economic policies enacted by the incoming administration having little impact on agriculture other than the implications from changes in exchange rates. But there is a good reason to be concerned that agricultural options might be underpriced: La Niña.
Historically, La Niña’s are associated with periods of exceptionally high realized volatility in corn, soy and wheat prices. This was the case during the most recent La Niña episode, which concluded in 2011, when soy and wheat implied volatility was around twice the current level, while implied volatility on corn occasionally spiked to around 1.5x its current level.
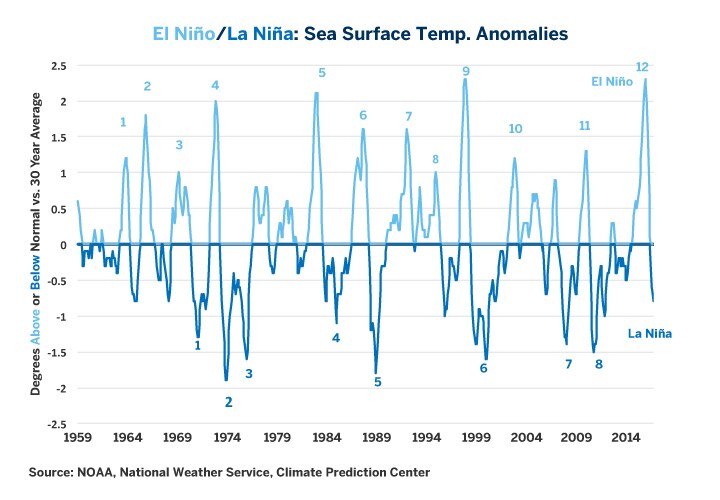
There is little doubt that the world is headed into a La Niña. Central and East Central Pacific Ocean sea surface temperatures have already fallen from a peak of +2.3°C above normal in December 2015 to 0.7°C below normal by the end of September 2016 (Figure 2) and they have almost certainly fallen further since.
Figure 1: Implied Volatility Near the Low End of Recent Ranges.
Figure 2: El Niño has Given Way to La Niña.
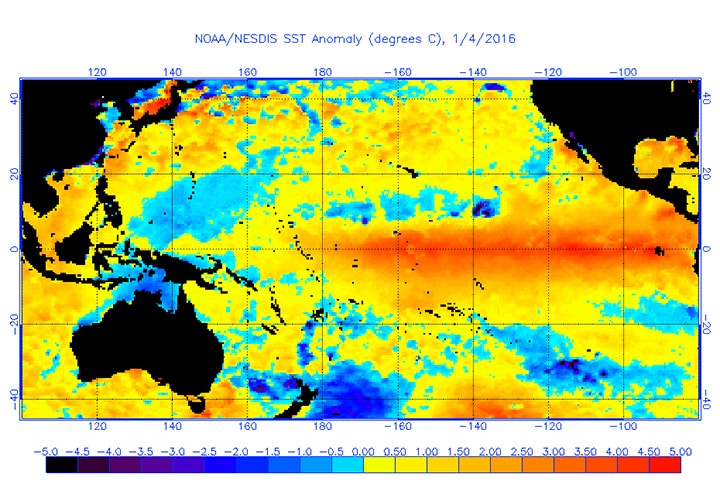
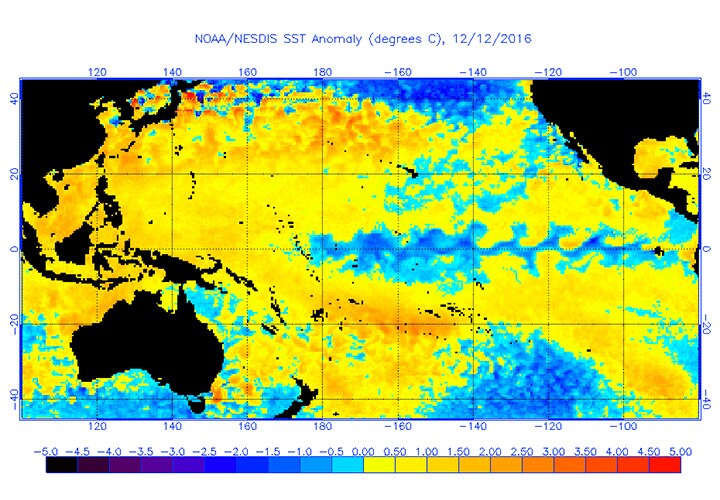
More broadly, the entire Pacific Ocean is cooling down relative to temperature at the beginning of the year (Figures 3 and 4) and this should impact weather in the Americas and elsewhere in the world over the next few months, and it has the potential to send agricultural crop production and prices on a wild ride. La Niña is associated with greater-than-usual precipitation across much of the Northwestern and Midwestern U.S. and Canada. Conditions tend to be drier than normal in the Southern United States. La Niña is correlated with wetter-than-normal weather in Brazil and the Central Andes while leading to much drier-than-normal conditions in coastal Chile and Peru. It can also impact the oil palm growing regions in Asia, including top producers Indonesia and Malaysia which can also experience much wetter-than-normal conditions.
Figure 3: Peak El Niño in Early January 2016.
Figure 4: La Niña Progressing as of Late November 2016 but (Probably) Nowhere Near Peak Intensity.
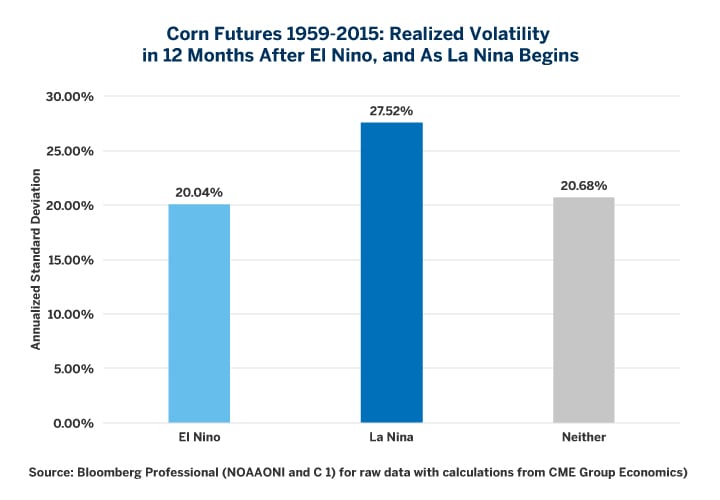
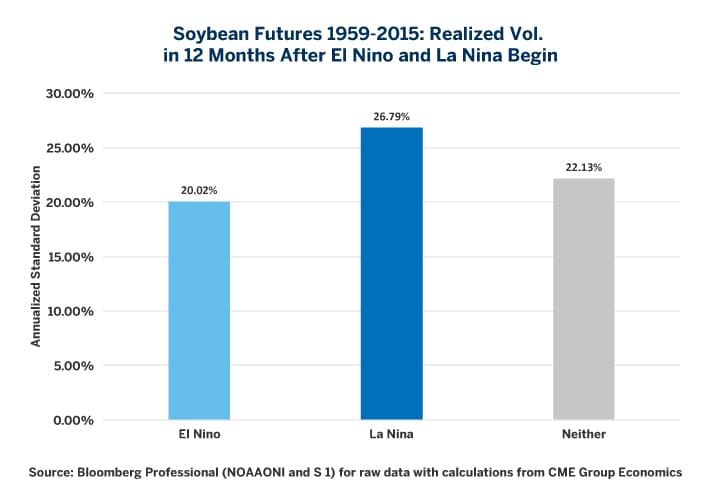
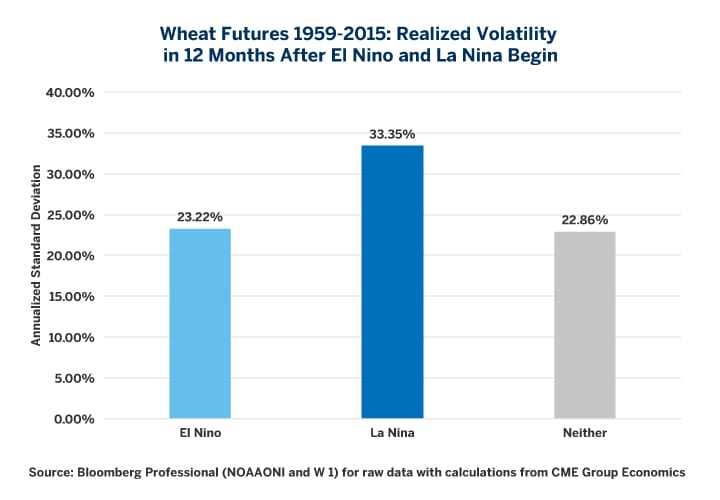
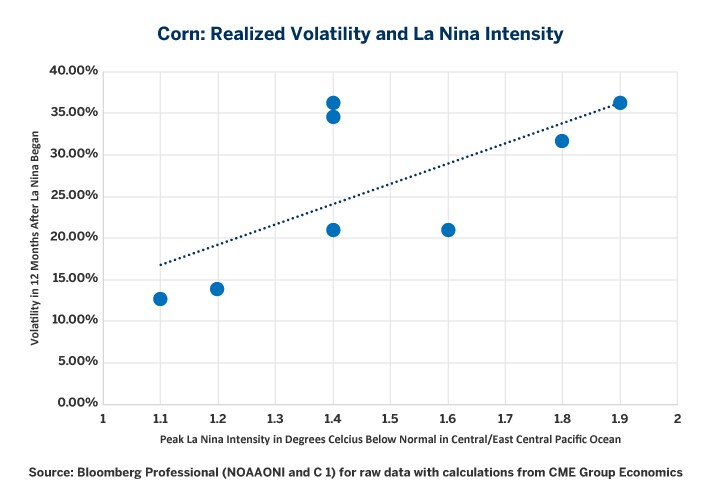
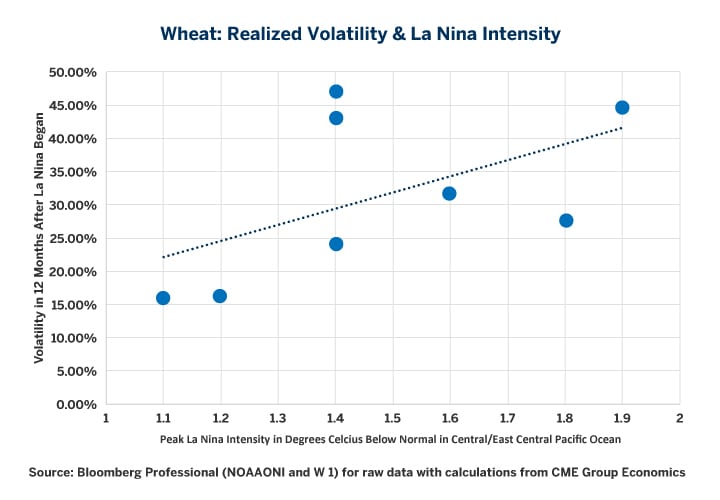
In short, since the late 1950s La Niñas have tended to increase uncertainty and amplify price moments in agricultural products markets. Over the past eight La Niña episodes, realized volatility for corn, soy and wheat has been approximately 1.5x normal (Figures 5-7) and generally, the more intense the episode the greater the realized volatility (Figures 8-10). While correlation is not causality, if the current episode of La Niña continues to intensify, the cost of options protection on corn, soy, wheat and other agricultural goods could begin to soar.
Figure 5: Corn Tends to be More Volatile than Normal During Periods of La Niña.
Figure 6: Soybeans Tend to be More Volatile than Normal During Periods of La Niña.
Figure 7: Wheat Tends to be Much More Volatile During Periods of La Niña.
Figure 8: The More Intense the La Niña, the Greater the Potential for Corn Volatility.
Figure 9: The More Intense the La Niña, the Greater the Potential for Soy Volatility.
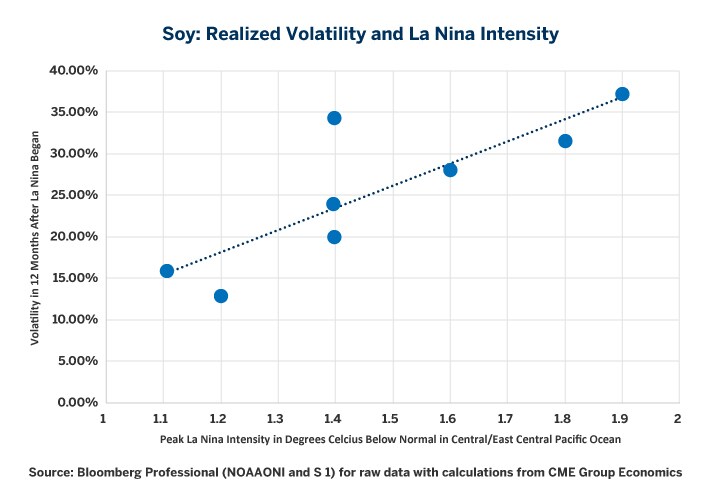
Figure 10: The More Intense the La Niña, the Greater the Potential for Wheat Volatility.
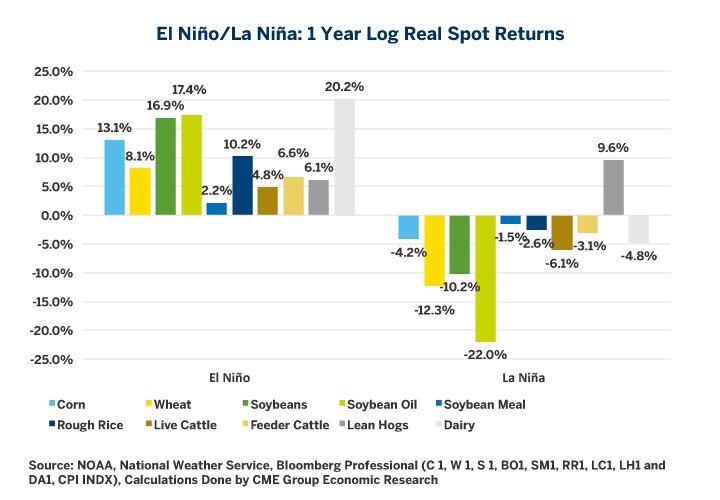
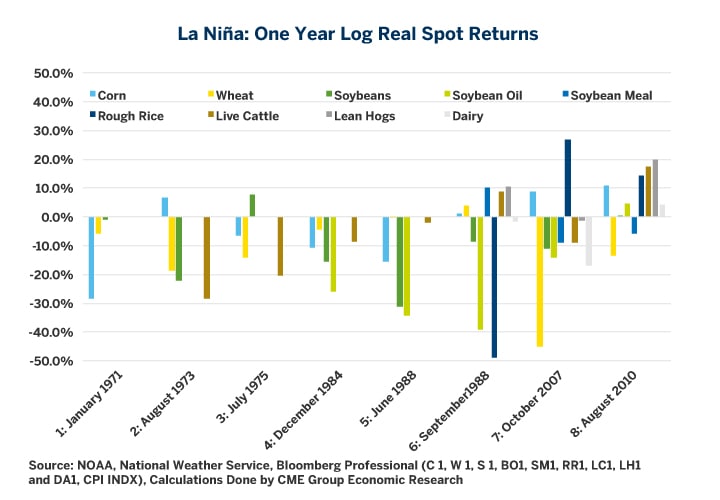
Finally, La Niña episodes, in general, have also correlated with lower prices for agricultural goods (Figures 11 and 12). Perhaps this shouldn’t come as too big of a surprise given that most markets tend to be more volatile on the way down than on the way up. What might save corn, soy and wheat this time is that their prices are already depressed, owing, in part, to the strength of the U.S. dollar (USD). Should the U.S. currency continue to strengthen, which is a distinct possibility given potential consequences of President-elect Trump’s proposed fiscal stimulus, agricultural products prices may indeed have further to fall from a USD perspective.