Copper: Sustained Rally Hinges on China, Trump
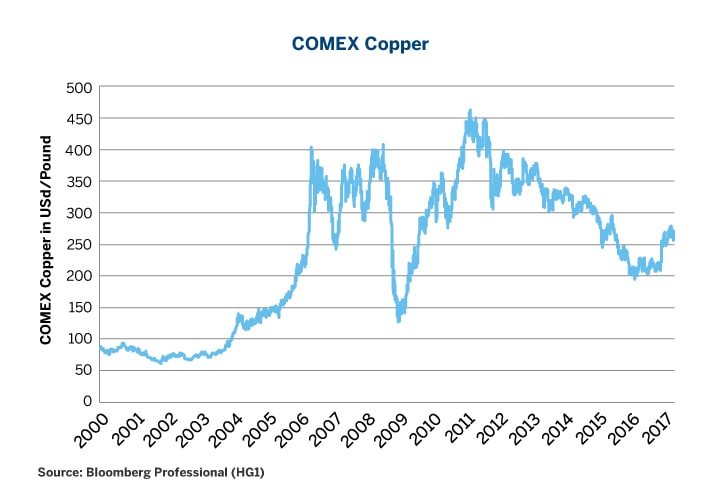
In just over a year, from mid-January 2016 to mid-February 2017, COMEX high grade copper prices soared 45%, erasing about one third of the 58% slump from the peak set in 2011 (Figure 1). Much of the rebound came after October 2016 and appeared to be supported by three factors.
- China’s economic growth rate stabilized, and even improved slightly.
- The election of Donald Trump as President, and the promise of fiscal stimulus.
- A strike at the Escondida mine in Chile which produces 5% of the world’s copper
Copper prices have been falling in recent weeks as each of the rallying points lose steam. First, the Escondida strike ended on Friday, March 24. Secondly, the Trump agenda is running into trouble in Congress. Thirdly, it’s not clear if China will be able to boost or even maintain its growth rate.
Figure 1: Copper has Recovered One Third of its Losses.
Supply: Still Growing After All These Years
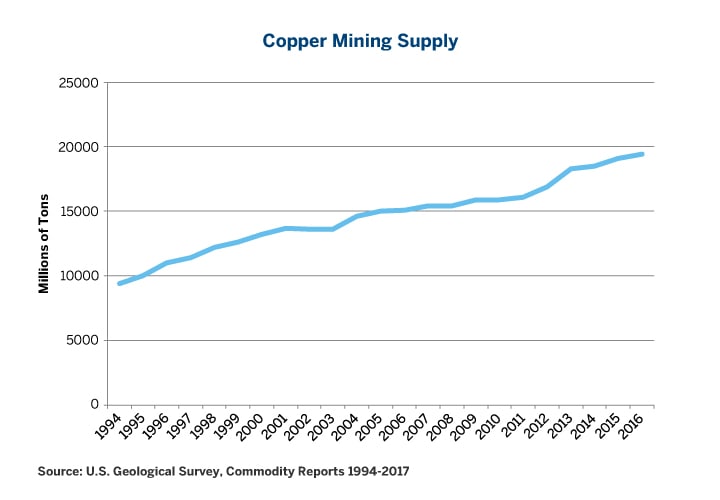
With workers returning to work at the Escondida mine after a two-month strike, it’s timely to examine more broadly the issue of copper supply. Worldwide copper production continued to grow in 2016 as it has for all but three of the past 22 years. World copper production has increased 105% since 1994, when the U.S. Geological Survey began estimating global output. Production in 2016 was about 1.6% higher than in 2015 (Figure 2).
Figure 2: Mining Supply up 105% Since 1994.
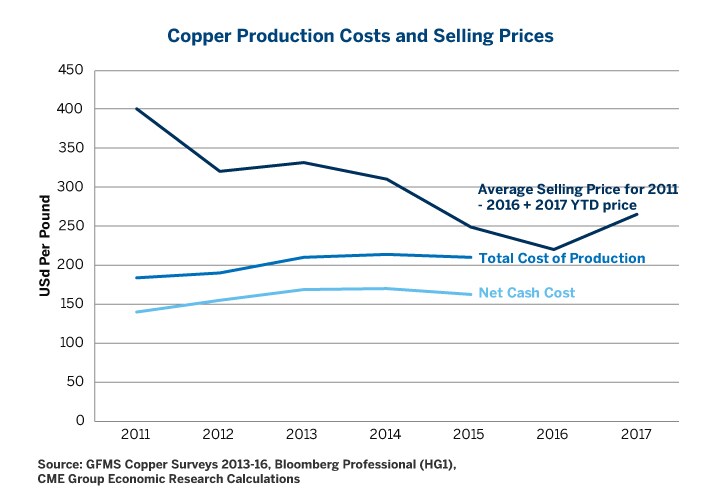
That copper supplies continued to grow in 2016 is impressive given the collapse in prices. It’s also not too surprising. The average price of copper in 2016 slightly exceeded the all-in cost of production and significantly exceeded the cash-only cost of producing the metal. But, while investment in copper mines has slowed significantly from the 2003-2013 go-go years, production is still climbing. While the increased production has been good for those who work in the sector, it’s not necessarily very positive news for the price of the metal going forward. Given the rebound in the price of copper, we estimate that mines, on average, are earning returns of over 20% on an all-in cost basis, and that the cash margin of producing copper (ignoring overhead costs, depreciation and amortization of equipment) is around 60% (Figure 3). This might imply further growth in mining output in 2017, at least once the Escondida strike impact is factored in.
Figure 3: Prices Still Exceed Production Costs.
Demand: Will Trump and China Come Through?
Last year’s Chinese stimulus package appears to have stabilized both China’s economic growth rate and the price of copper, but the big rally in copper began in late October 2016 as the tide began to turn in favor of Donald Trump in the U.S. election. Trump’s victory brought with it the notion that Washington’s policy gridlock would end and that fiscal stimulus, in the form of tax cuts and infrastructure spending, would give a boost to U.S. and global economic growth. For several months that expectation dominated trading of not just copper but equites, bonds and even the U.S. dollar. With the collapse of health care reform in late March, however, hopes for a broader fiscal stimulus have begun to diminish.
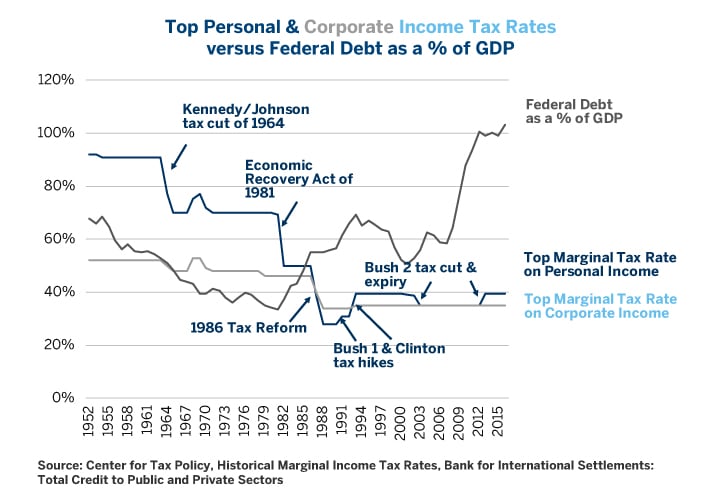
While tax reform and infrastructure spending are less visceral issues than life-or-death health care debates, both could face hurdles as they make their way through Congress to the possible detriment of those who are bullish on copper. In the past, Republicans have scored major political successes with taxes. In August 1981, President Ronald Reagan signed the Economic Recovery Tax Act, which brought the top marginal rate on personal income down from 70% to 50%. In its second term, the Reagan Administration brought more far reaching changes as the 1986 Tax Reform Act lowered top rates from 50% to 28% on personal income, and cut rates on corporate income from 46% to 34%. Unlike the earlier Reagan tax cuts, the 1986 tax reform was revenue neutral, closing loopholes in exchange for reducing rates.
However, under Reagan, the debt load exploded. Public debt as a percentage of GDP rose from 33% in 1981, when Reagan took office, to 69% when his successor, George Herbert Walker Bush, left in 1993. Under Bush and Clinton, Congress enacted tax increases that partially reversed the Reagan tax cuts. This stabilized and then later reduced the national debt from 69% to 51% of GDP by the time George W. Bush entered the White House in 2001. His administration cut taxes on personal income in 2001, and on dividends in 2003 and once again the Federal debt began to soar. Debt was back to 59% of GDP by 2007, on the eve of the financial crisis, and had hit 100% of GDP by 2012. President Barack Obama and Congress were unable to reach any agreement on extending the Bush tax cuts as well as the Obama payroll tax cut in late 2013, and taxes rose again, stabilizing since then the Federal debt to GDP at around 100% (Figure 4).
Figure 4: Guess What? Tax Cuts Don’t Usually Pay for Themselves.
Trump promised sweeping personal and corporate income tax cuts during the campaign but they could be hard to deliver. For starters, U.S. Federal debt to GDP was 102% at the time he took office and not 33% like it was when Mr. Reagan came to power. As such, it’s not too surprising that since the election, talk on taxes has shifted from big 1981-style tax cuts to a more 1986-like revenue neutral tax reform. Outright tax cuts and revenue neutral reform have very different implications for markets, including copper. The former would be expected to boost short-term economic growth and prices for industrial metals. The latter might make for a more efficient distribution of resources and higher long-term productivity growth but could have little impact on the economy’s short-term prospects.
Moreover, it’s far from clear that the Republican majority in Congress will have an easier time reaching a consensus on taxes, having failed to reach a compromise on healthcare. Republicans could have to grapple with questions like: Should the tax initiative be revenue neutral? Should corporate tax reform involve a border adjustment tax? Can personal tax rates be cut outright or only in exchange for abolishing loopholes and, if so, which ones? For the moment we have answers to none of these questions, which will prove highly contentious.
Infrastructure spending could prove just as controversial. Will it be publically financed? If so, conservatives might object. Will it be done by offering tax breaks to construction companies? In that case, liberals might not be supportive.
Finally, health-care reform proved that even members of Mr. Trump’s own party would not fall in line. If his approval rating continues to fall, it might make it even more difficult for him to push legislation through Congress, particularly if it involves making difficult or painful choices that could offend key constituencies. If nothing gets done in Washington, which is a distinct possibility, this could prove to be bad news for copper and other industrial metals.
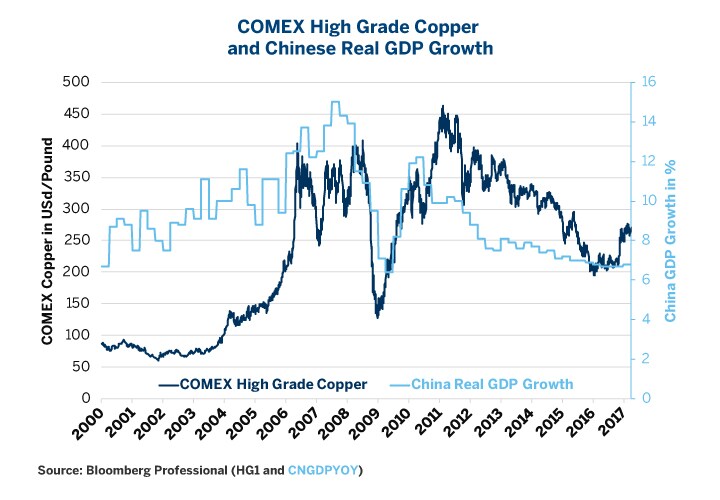
Of even greater significance to copper is China, which accounts for about 45% of global consumption. China incorporates much of the metal into higher value-added products and re-exports, while some is used domestically. Even so, it difficult to understate China’s centrality to the copper market (Figure 5).
Figure 5: Copper has More-or-Less Tracked Chinese GDP Growth Since 2000.
As Chinese President Xi Jinping begins his second mandate, the Chinese economy is beset by problems:
- Total debt (public + private) has soared to 255% of GDP, in line with debt levels in slow-growing Western European nations and the United States.
- China has an overvalued currency, which has risen 30-40% against most currencies in emerging and developed economies, with the exception of the U.S. dollar. An overvalued currency has contributed to a decline in Chinese exports since 2014.
- The State Administration of Foreign Exchange has been defending the Renminbi by selling off currency reserves to the tune of $1 trillion over the past two years. This can’t continue endlessly, even if China has $3 trillion left in reserves.
- China probably needs to lower interest rates further in order to maintain growth rates but cannot do so for fear of generating capital flight or further inflating real estate bubbles.
China’s leadership did a great job of stabilizing growth heading into the recent Communist Party Congress but Xi will probably have to make more significant reforms during this second mandate, which could jeopardize China’s growth rate and hence its ability to continue consuming industrial metals at the pace to which markets have become accustomed to.
If China’s growth dips again, which is a significant possibility, it will likely take copper down with it. Other economies like Russia and Brazil might show signs of recovery, and India continues to grow nicely — this represent the primary upside risks to copper. However, these and other BRIC economies combined amount to only 60% of China’s economy, the second largest in the world after the United States. As such, their prospects for rescuing copper from a renewed slowdown in China is rather dim.
The Chinese government may be able to expand credit for a while longer, benefitting the country’s economic growth rate and copper in the short term. Doing so, however, could make the ultimate day of reckoning all the more painful.