Oscillators: MACD, RSI, Stochastics
Oscillators are a group of technical indicators that attempt to indicate the strength of a trend and if a market is over-bought or over-sold. Each indicator uses slightly different inputs in the calculations, but they try to give traders insight into whether a market is going to continue to move with the same trend or reverse direction.
The term oscillator comes from the fact that they move within, or oscillate between, two predefined levels. No matter how far the market moves up or down, the indicator will never move above or below its set range.
These conditions can lead to two issues. First, the indicator can remain at over-bought or over-sold for a long period of time if the trend is strong. This means reversal signals can be shown for a long time before the market begins to reverse. The second issue is because the indicators are always a step behind what the market is doing, this is known as a lagging indicator.
Oscillator Signals
Oscillators are generally designed to indicate signals in two ways: with crossovers of the indicator lines and by indicating divergences where price and the oscillator no longer move in the same direction.
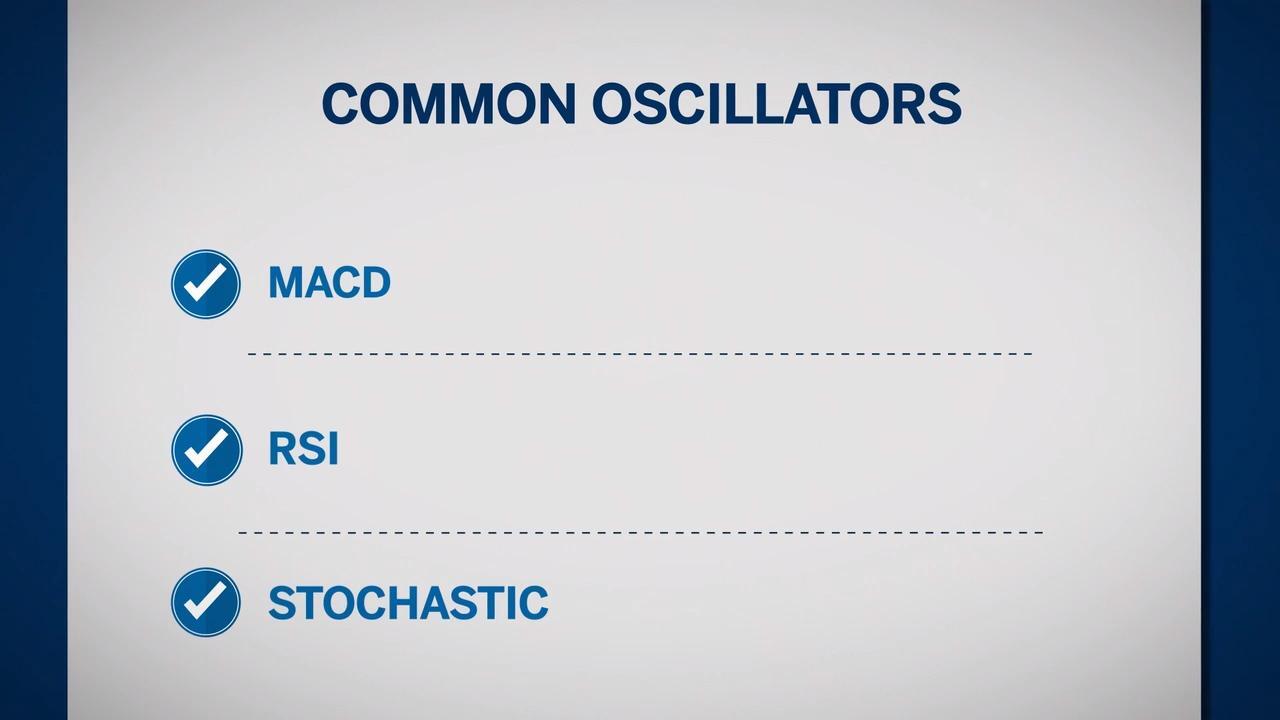
The three more popular oscillators are Moving Average Convergence Divergence (MACD), Relative Strength Index (RSI) and Stochastics.
Moving Average Convergence Divergence (MACD)
The Moving Average Convergence Divergence indicator attempts to gauge the strength of a trend. Unlike other indicators that show the direction of price, the MACD shows the direction of the momentum of the trend.
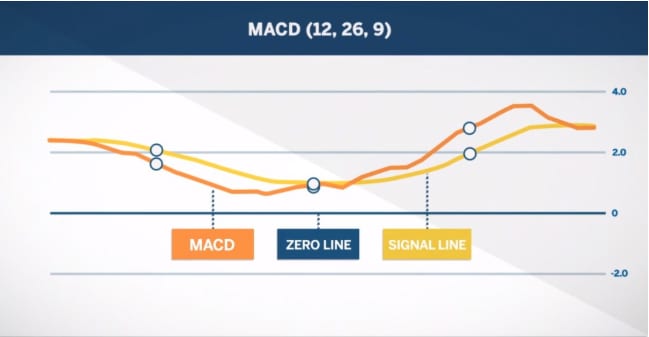
The indicator has three parts:
- The MACD line, which is calculated by subtracting a long moving average from a short moving average. Typically subtracting the 26 Exponential moving average from the 12-period exponential moving average.
- The signal line which is usually a nine-period exponential moving average
- The zero line
Signals are generated when the MACD line crosses the signal line. If the MACD moves below the signal line, this is generally an indication of a down move; if the MACD moves above the signal line, it is typically seen as an indication of a potential up move.
Another signal is if the MACD line is above or below the zero line. If the MACD line is above zero, traders generally say the market is over-bought and may move down. If the indicator is below the zero line, traders generally say the market is over-sold and may move back upward.
Another signal that traders look for is a divergence from price. The MACD line should move up and down with the trend of price and if it starts to diverge, that might indicate a change in the trend of price. For example, if the MACD starts to move lower and price is moving higher, it can be an indication that price might be setting up for a reversal.
Relative Strength Index
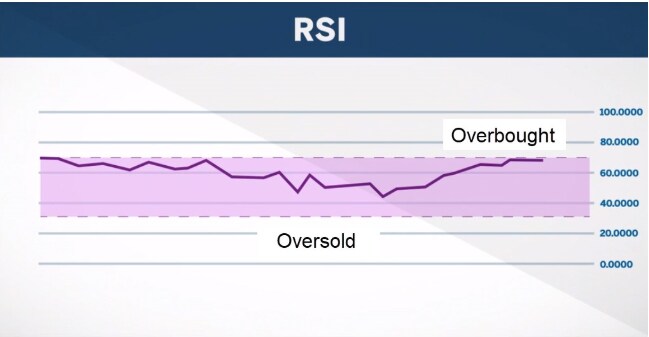
The Relative Strength Index (RSI) compares the average size of the up moves over a period with the average size of the down moves over that same period of time.
If the RSI is over 70, this is generally seen as over-bought and price might move down. A reading of 30 indicates a market that is over-sold and price might move up. Traders can use the indicator to assess a market after a large, quick move up or down. If a market spikes and RSI moves above 70, it could mean the market is extended beyond what might be normal for that market and price could pull back. On the other hand, if price spikes and RSI does not go past 70, there might be more room for the market to continue to move higher.
Stochastics
The Stochastics indicator compares the recent close of a stock to the range of opening and closing prices over a previous period. The basis of the assumption is markets in an up-trend will close near the high of their range and stocks in a down-trend will close near the bottom of their range.
The two lines on the indicator are referred to as the K and D lines. The K line measures momentum and the D line measures the average momentum.
Typically, a reading over 80 is considered over-bought and a reading below 20 is considered over-sold. This means the stock is trading either near the top of its range or near the bottom of its range.
Divergences can also be signals of reversals in a market’s price. For example, if a market makes new, lower lows but the Stochastics indicator makes a series of higher lows, this might indicate a bottom is forming in the market.
Conclusion
Oscillators are price-following and use price history to gauge the strength of the trend and if the trend will continue in the near-term or may be getting close to reversing.
Because of the calculations these oscillators might indicate over-sold or over-bought for a long time, creating a situation where the indicator is signaling a reversal but the market continues to move up or down in its original trend.
Like any indicator, oscillators should be used in conjunction with other information you gather. Most of the time, signals from oscillators are confirmed with increasing volume and ignored with decreasing volume.
Keep track of how the indicators react to your favorite market and decide if the signals they produce create good trade entries and exits.