Markets Home

Active trader

Hear from active traders about their experience adding CME Group futures and options on futures to their portfolio.

Find a broker

Search our directory for a broker that fits your needs.

CREATE A CMEGROUP.COM ACCOUNT:

MORE FEATURES, MORE INSIGHTS

Get quick access to tools and premium content, or customize a portfolio and set alerts to follow the market.
Market Data Home

Real-time market data

Stream live futures and options market data directly from CME Group.

E-quotes application

Access real-time data, charts, analytics and news from anywhere at anytime.

CME DATAMINE:

THE SOURCE FOR HISTORICAL DATA

Explore historical market data straight from the source to help refine your trading strategies.
Services Home

Uncleared margin rules

Understand how CME Group can help you navigate new initial margin regulatory and reporting requirements.

Calculate margin 

Evaluate your cleared margin requirements using our interactive margin calculator.
Education Home

FX Insights from Macro Hive

Receive exclusive insights on key FX macro themes, volatility trends, and market events through our bi-weekly report.

Create a CMEGroup.com Account: More features, more insights

Get quick access to premium educational content, including expert-led webinars, a real-time trading simulator, and more.
      Course Overview
      • What is SOFR
      • Trading SOFR Futures
      Introduction to SOFR
      You completed this course.Get Completion Certificate

      Trading SOFR Futures

      Video not supported!

      CME Group will launch one-month and three-month futures contracts based on the Secured Overnight Financing Rate  (SOFR) on May 7, pending regulatory approval.

      The combination of one-month and three-month contracts is expected to facilitate price discovery at various points of the money market curve.
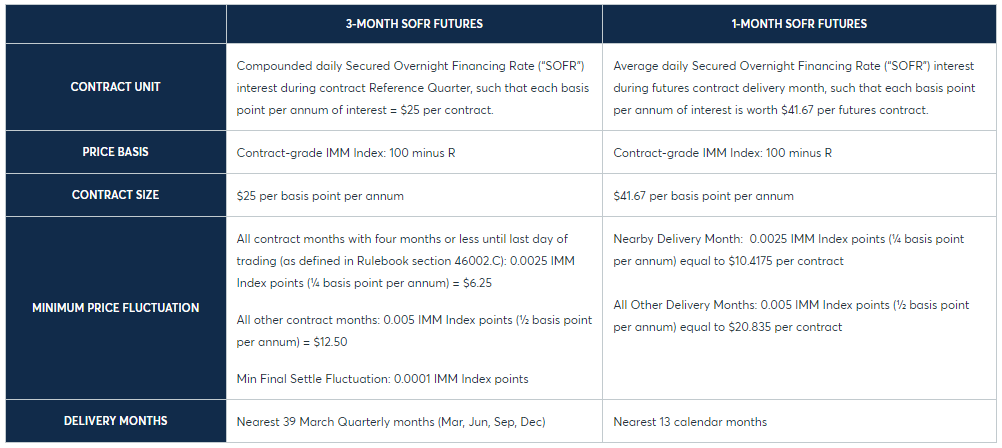
 The spreading opportunities against well-established liquidity pools of 30-Day Federal Funds and three-month Eurodollar futures will help develop liquidity in both one-month and three-month contracts based on the overnight SOFR.

      The one-month SOFR futures contracts will apply the monthly average of overnight SOFR to one-month contracts that are nearly identical to our 30-Day Fed Fund futures in terms of contract design.

      The three-month SOFR futures contracts will be broadly similar to three-month Eurodollar futures in terms of contract size ($25 per basis point) and IMM calendar. The final settlement prices will be determined by daily compounding of the overnight SOFR over the applicable IMM dates.

      Exchange Calculation Methods

      The exchange calculation methods (averaging monthly) and compounding (quarterly) for determining final settlement prices for one-month and three-month SOFR futures are expected to significantly reduce the impact of the volatility potentially observed in the daily overnight SOFR values at quarter-end. Comparisons of one-month SOFR futures to 30-Day Federal Fund futures on the following pages suggest that heightened volatility in quarter-end SOFR values may have been unique to Q2 and Q3 2016. 

      Contract Critical Dates: Three-Month SOFR Futures and Three-Month Eurodollar Futures

      Three-month SOFR futures contract month naming convention will mirror the well-established convention for three-month Eurodollar futures. The similarities of the applicable cash flow dates are key to understanding the three-month difference in last trading days for identically-named contract months.

      For example, consider two futures contracts:

      A three-month SOFR futures contract (SR3) comes to final settlement on the third Wednesday of December. The reference quarter, the interval of interest rate exposure that informs the contract final settlement price, starts on the third Wednesday of the preceding September.

      A three-month Eurodollar futures contract (GE) comes to final settlement on the Monday before the third Wednesday of the preceding September. The final settlement price is based on the USD three-month ICE LIBOR® that corresponds to a three-month unsecured bank funding transaction that settles on the third Wednesday of September and matures three months later.

      Both will be referenced as September contracts. The interval of interest rate exposure for one is essentially the same as for the other. Importantly, the settlement date corresponding to the three-month term bank funding rate that corresponds to the September GE contract matches the start date of the contract reference quarter, the period over which daily SOFR interest is compounded, for the September SR3 contract.

      One-Month SOFR and One-Month EFFR

      For an expiring 30-Day Federal Fund futures contract, the final settlement price is set as 100 minus the arithmetic average of daily EFFR during the contract delivery month. The gray line in Exhibit 1 traces these average interest rate levels for each of the 37 months between September 2014 and September 2017, inclusive. The blue line in Exhibit 1 is the outcome, if the same calculation is applied to obtain the arithmetic average of estimated historical daily SOFR values for each of the same 37 months.[1]

      Exhibit 1: Calendar-Month Averages of Daily Interest Rates (Basis Points per Annum) for EFFR and SOFR, September 2014 through September 2017

      Source: FRBNY


      Although month-averaging smooths over much of SOFR’s comparatively lively day-to-day volatility, at least some residual effect persists. In Exhibit 1, the median absolute change from one month-average to the next is 0.8 basis points for EFFR. By contrast, it is 2.8 basis points for SOFR, over three times more volatile.

      Other Comparative Features

      Over the entire span, monthly SOFR levels normally run 3.3 basis points below monthly EFFR.

      Although the sample is far too small to be conclusive, it suggests that the SOFR-EFFR spread varies in relation to monetary policy. From September 2014 through November 2015, prior to the Federal Open Market Committee’s initial decision to raise its EFFR target in December 2015, monthly SOFR averaged a mere 1.4 basis points less than monthly EFFR. By contrast, between November 2016 and September 2017, during which time the FOMC hiked its EFFR target thrice, for a cumulative increase of 75 basis points, the spread expanded to 10.3 basis points.

      On occasion, anomalies in daily SOFR volatility may be large enough to exert impact on month-average SOFR. This is exemplified by two episodes in which Treasury GC repo rates spiked during the final weeks of June and September 2016. In each case, the usually positive SOFR-EFFR spread was temporarily flipped, with month-average SOFR exceeding the corresponding month-average EFFR by 4.9 basis points.

      Three-Month SOFR, Three-Month EFFR and Three-Month ICE LIBOR®

      CME Group will apply compounding of daily SOFR values between quarterly IMM dates (the third Wednesday of every March, June, September and December) to determine final settlement prices of expiring three-month SOFR futures. The compounding conventions will be consistent with, and familiar to, users of standard U.S. dollar overnight index swaps, for which a swap’s floating-rate leg is based on the business-day-compounded EFFR.

      As with the averaging process for one-month SOFR futures, the compounding process for three-month SOFR futures is anticipated to dampen the impact of day-to-day volatility in SOFR. This is evidenced in Exhibit 2, which compares the paths of three-month compounded daily SOFR, three-month compounded daily EFFR, and USD three-month ICE LIBOR® from August 22, 2014 through July 17, 2017.

      Exhibit 2: 3-Month Compounded Daily SOFR, 3-Month Compounded Daily EFFR, and USD 3-Month ICE LIBOR®, 22 August 2014 through 17 July 2017

      Sources: FRBNY, ICE Benchmark Administration Ltd


      For three-month EFFR and three-month SOFR, each date denotes the start of the corresponding three-month interval over which daily SOFR or daily EFFR is compounded and then transformed into a three-month term interest rate per annum.

      For example, on August 22, 2014 the three-month SOFR and three-month EFFR values denote the term interest rates per annum that result from daily compounding of SOFR values and EFFR values, respectively, during the interval from August 22, 2014 to November 24, 2014.

      Similarly, on August 22, 2014 the USD three-month ICE LIBOR® value is for settlement on that date, i.e., it is the value that would have been determined by ICE Benchmark Administration Ltd. two London bank business days earlier, on August 20, 2014, for standard t+2 settlement.

      A distinction worth note is that, on any given date, the three-month EFFR and three-month SOFR estimates are hypothetical perfect foresight rates, determined on the basis of the daily values of EFFR and SOFR that materialized in fact over the ensuing three months. By contrast, the corresponding three-month ICE LIBOR® value for the same date is a bona fide market rate, reflecting market expectation (rather than full knowledge) of the course of market rates over the ensuing three months.


      Other Comparative Features

      Over the entire span, monthly SOFR levels normally run 3.3 basis points below monthly EFFR.

      Although the sample is far too small to be conclusive, it suggests that the SOFR-EFFR spread varies in relation to monetary policy. From September 2014 through November 2015, prior to the Federal Open Market Committee’s initial decision to raise its EFFR target in December 2015, monthly SOFR averaged a mere 1.4 basis points less than monthly EFFR. By contrast, between November 2016 and September 2017, during which time the FOMC hiked its EFFR target thrice, for a cumulative increase of 75 basis points, the spread expanded to 10.3 basis points.

      On occasion, anomalies in daily SOFR volatility may be large enough to exert impact on month-average SOFR. This is exemplified by two episodes in which Treasury GC repo rates spiked during the final weeks of June and September 2016. In each case, the usually positive SOFR-EFFR spread was temporarily flipped, with month-average SOFR exceeding the corresponding month-average EFFR by 4.9 basis points.

      Using these Comparisons

      For the entire interval, three-month daily compounded SOFR rates average 3.2 basis points per annum below corresponding three-month daily compounded EFFR rates, comparable to the average spread of 3.3 basis points per annum between month-average levels of EFFR and SOFR for the same period.

      The three-month compounding interval effectively squelches the differences in volatility between daily EFFR and daily SOFR. For the interval in Exhibit 2, the median absolute day-to-day change in three-month daily compounded rates is nearly identical for EFFR and SOFR, 0.2 basis points. Likewise, the mean absolute day-to-day change is essentially equal for both: in each case, slightly more than 0.4 basis points.

      On average, the spread between three-month daily compounded SOFR and 3-month ICE LIBOR® is 23.7 basis points.

      As before, the spread appears to vary with the tone of U.S. monetary policy. The average for the interval from August 22, 2014 through year-end 2015 is roughly 15.2 basis points. For the spell from start of 2016 through July 17, 2017, it doubles to around 31.1 basis points.

      Contract Specifications-Three-month SOFR Futures and One-month SOFR Futures

      [1] Historical daily values of the SOFR are as estimated and published by FRBNY. See Joshua Frost, Presentation at the Alternative Reference Rates Committee Roundtable, FRBNY, New York, November 8, 2017, which is available at: https://www.newyorkfed.org/medialibrary/media/newsevents/speeches//2017/Frostpresentation-data.xlsx and

      Kathryn Bayeux, Alyssa Cambron, Marco Cipriani, Adam Copeland, Scott Sherman, and Brett Solimine, Introducing the Revised Broad Treasuries Financing Rate, Federal Reserve Bank of New York Liberty Street Economics, FRBNY, New York, June 19, 2017, revised January 30, 2018, which is available at: http://www.newyorkfed.org/medialibrary/media/research/blog/2017/LSE_2017_Cipriani_broadfinancing_data.xlsx


      Test your knowledge

      Related Courses
      /content/cmegroup/en/education/courses/introduction-to-sofr/trading-sofr-futures
      • {{ course.name }}
      Previous Lesson
      Next Lesson
      Course Overview
      Get Completion Certificate
      Previous Lesson Next Lesson
      • YouTube
      • Twitter
      • Facebook
      • LinkedIn
      • Instagram
      • Rss

      CME Group is the world's leading and most diverse derivatives marketplace. The company is comprised of four Designated Contract Markets (DCMs). 
      Further information on each exchange's rules and product listings can be found by clicking on the links to CME, CBOT, NYMEX and COMEX.

      © 2021 CME Group Inc. All rights reserved.

      Disclaimer  |  Privacy Policy  |  Cookie Policy  |  Terms of Use  |  Data Terms of Use  |  Modern Slavery Act Transparency Statement  |  Report a Security Concern