Understanding the CVOL Index
The options market provides insight into how much uncertainty the market anticipates. Greater uncertainty generally leads to higher implied volatility levels. Implied volatility is a measure of expected future “bounciness” of the underlying, as opposed to realized volatility, which is a measure of what has already happened. Using options pricing models, market participants have been able to calculate the implied volatility of specific options at specific strikes.
Implied Volatility Curve
The collection of these implied volatility levels with the same expiration is called the Implied Volatility Curve.
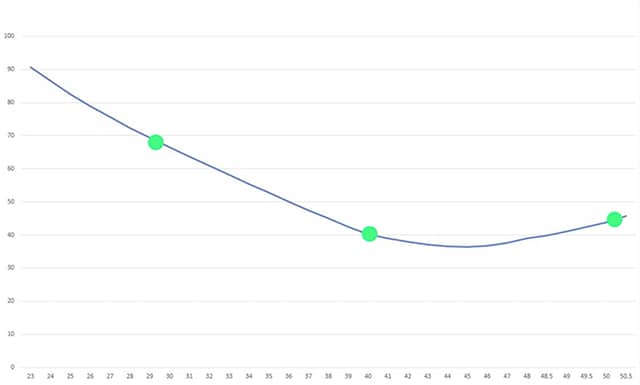
Looking at a sample volatility curve, assume the at-the-money strike has a volatility of 40. A way out-of-the-money put has a volatility of nearly 70, and an out-of-the-money call has a volatility of 45. If these options are all derived from the same underlying instrument – how do you know which volatility level is the best to follow?
Traditionally, the at-the-money strike’s implied volatility has been quoted as representative of the expected risk. But we can see that out-of-the-money options are implying higher volatility for the same asset in the same time frame.
As every strike on the curve has a different implied volatility level, that begs the question – is there a way to interpret these options prices into a single, meaningful volatility estimate?
Variance estimate
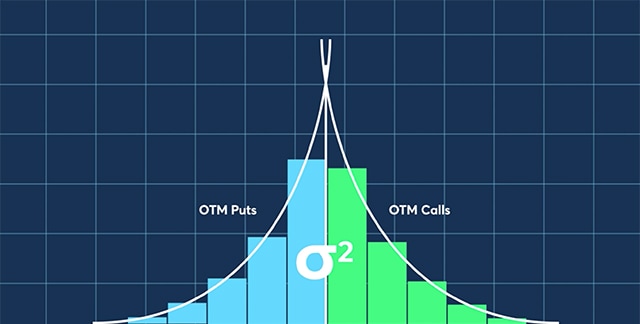
The CVOL Index is based on the variance estimate. Variance creates one value by using every single strike on the implied volatility curve. Thus, capturing all the market information and distilling this aggregate to a single number. Looking at a range of option strikes with the same expiration, we see that further out-of-the-money options are priced lower than at-the-money options.
| Calls | Strike | Puts |
|
22.10 [text-align: center] |
35 [text-align: center] |
0.10 [text-align: center] |
|
17.30 [text-align: center] |
40 [text-align: center] |
0.30 [text-align: center] |
|
12.75 [text-align: center] |
45 [text-align: center] |
0.75 [text-align: center] |
|
8.00 [text-align: center] |
50 [text-align: center] |
1.00 [text-align: center] |
|
4.50 [text-align: center] |
55 [text-align: center,background-color: #e3e935] |
2.50 [text-align: center,background-color: #e3e935] |
|
2.00 [text-align: center] |
60 [text-align: center] |
5.00 [text-align: center] |
|
0.90 [text-align: center] |
65 [text-align: center] |
8.90 [text-align: center] |
|
0.25 [text-align: center] |
70 [text-align: center] |
13.25 [text-align: center] |
|
0.10 [text-align: center] |
75 [text-align: center] |
18.10 [text-align: center] |
For example, the 35-put is priced at .10 while the 55-put is 2.50.
To demonstrate the variance estimate, the option prices are plotted vertically with the strikes arranged across the horizontal axis. Shown in this manner, the out-of-the-money options begin to reveal a smooth curve as the strikes approach the price of the future.
Since only out-of-the-money options are used, there is a boundary at the price of the underlying future – which is 57. As the out-of-the-money calls are added, we see the curve being mirrored.
The measurement of the area under the two curves is representative of the implied variance in this set of options. With the option prices as a “height” and the average distance between the strikes as a “base”, individual areas under this curve can be calculated.
These areas, shown as rectangles, can then be added together to estimate the total area under the curve. The total area under the curve is the variance and the square root of variance is the standard deviation. When annualized, the standard deviation becomes the usable volatility number that is representative of the prices for all the options, rather than simply the at-the-money estimate often used as a quick reference.
The variance estimate can be calculated by anyone, but the process can be time consuming with the risk of inaccurate calculations.
CVOL Index
The CVOL Index provides both a live and a historical data set, calculated using CME Group’s methodology on its own options prices.
As with other implied volatility historical data sources, this data can be used for analysis, event triggers, or strategy back testing. Because this method is the same for every asset class, volatilities of multiple asset classes can be compared to each other on a level playing field.
The individual product indices can be aggregated to create a broad-based index that tracks the implied volatilities of multiple products together.
Live streaming indices are available on CME Direct and supporting independent software vendors (ISV). Historical data is available on through CME Datamine and QuikStrike. These calculations are made daily, updated at the end of every trading day, and stored in a downloadable format.
The concept of simple variance can be used to improve existing measures of expected volatility. CVOL indexes use an improved simple variance estimation method to provide expected volatility metrics derived from the entire Implied Volatility Curve. The original simple variance methodology was introduced in two papers by Ian Martin, Professor of Finance at the London School of Economics, which provide more information about simple variance and its applications: Simple Variance Swaps and What is the Expected Return on the Market?