https://www.cmegroup.com/content/dam/cmegroup/education/images/articles/2019/eq-gibbs_984x137.jpg
U.S. Equity Futures for the Australian Asset Manager
U.S. Equity Index Futures for the Australian Asset Manager
At the time of this writing, December 2018, the global equity markets are experiencing a period of increased volatility and forward price uncertainty. Equity asset managers have been challenged this year with falling index price levels, asset redemptions, and a plethora of conflicting macro-economic and geo-political news. Will 2019 bring more of same and what tools can Australian equity asset managers and superannuation funds use to help manage their equity index exposure?
In this note we will outline how CME Group equity index futures are used by asset managers and pension funds to manage existing index risk, gain capital efficiencies and to explore how they may employ them to enhance overall portfolio performance.
Why would a U.S. centric index-based futures contract like the E-mini S&P 500® (ES) Index futures be of interest to an Australian asset manager or a superannuation fund? After all, aren’t most global asset managers pegged to a global equity index?
According to recent APRA data Australian superannuation funds’ allocation to equity markets are weighted 22.8% domestic and 24.7% international. The international component is generally benchmarked to the MSCI World ex Australia Index. Let’s consider the degree of correlation of the S&P 500 (SPX) Index to the MSCI World ex Australia Index as a starting point. The S&P 500 Index is a cap weighted index comprised of roughly 500 large cap U.S. companies and takes in about 80% of the total capitalization of the U.S. equity market. The MSCI World ex Australia Index captures large and mid-cap companies across 22 of 23 Developed Market countries excluding Australia. With over 1,500 constituents, the index covers approximately 85% of the free float-adjusted market capitalization in each country.1
Benchmark Index Annualized Returns
| Year | S&P 500 Index | MSCI World Ex AUS | S&P/ASX 200 Index |
| 2009 | 23.4% | 31.5% | 30.8% |
| 2010 | 12.8% | 10.4% | -2.6% |
| 2011 | 0.0% | -9.4% | -14.5% |
| 2012 | 13.4% | 13.4% | 14.6% |
| 2013 | 29.6% | 20.3% | 15.1% |
| 2014 | 11.4% | 2.1% | 1.1% |
| 2015 | -0.7% | -4.3% | -2.1% |
| 2016 | 9.5% | 5.6% | 7.0% |
| 2017 | 19.4% | 21.6% | 7.0% |
Source: Bloomberg
According to recent analysis on Bloomberg the correlation of the S&P 500 Index to the MSCI World ex Australia Index was 0.766, a relatively high level of correlation. Additionally, U.S. companies represent close to 65% of the MSCI World ex Australia Index valuation. The Top Ten holdings, representing over 12% of the total value, are all U.S. corporations. U.S. equity index futures traded at CME Group provide a deep pool of actionable liquidity and the E-mini versions traded on CME Globex, CME’s electronic execution platform, are available 23-hours per trading day. Access to liquid benchmark products around the clock is essential to the modern risk manager and fiduciary.
Beta Replication
At the core of large institutional use of equity index futures is the concept of beta replication. Because ES futures have a high correlation to the SPX they can be used to create equivalent long or short positions relative to the beta target of a portfolio tracking the SPX. One of the distinguishing features of futures versus other possible beta replicators is their capital efficiency.
Because futures are not assets they do not require full payment for their notional value at time of execution. What they do require is a performance bond, sometimes referred to as initial margin. Initial margins on equity index contracts at CME Group generally equate to 4%-8% of the contract’s notional value. For examples, see the table below.
| Contract | Symbol | Index points | Multiplier | Notional | Margin* |
| E-mini S&P 500 | ES | 2552.50 | $50 | $127,625 | $6,600 |
| E-mini Russell 2000 | RTY | 1386.40 | $50 | $69,320 | $3,905 |
| E-mini Nasdaq 100 | NQ | 6466.25 | $20 | $129,325 | $7,700 |
| E-mini Dow Jones | YM | 23672.0 | $5 | $118,360 | $6,160 |
| Nikkei (USD) | NKD | 21130.0 | $5 | $105,650 | $6,160 |
Source: CME Group 12/21/2018. *margins subject to change by CME Clearing. Consult your FCM for current margins.
As indicated in the table above each equity index futures contract has its own reference index, index price which is determined by the market, a fixed multiplier, a notional value, and margin level. The margin level is determined by CME Clearing and subject to change. Margin levels are influenced in large part by product price volatility. As volatility in the product rises so will the margin. The notional, or financial equivalent, value of the futures contracts is a simple calculation of index price multiplied times the fixed multiplier amount.
Notional Value (NV) = Index price x Contract multiplier
From the table you can easily see the notional value resulting from the index value times multiplier. The NV allows the risk manager or trader the ability to determine the number of futures contracts needed to create a hedge or beta replication position. We will explore this further in the next section.
Cash Equitization
Cash is a necessary component of just about every investment portfolio. Cash is present in a portfolio for operational reasons including managing subscription/redemption flows and from income streams such as dividends. Non-invested cash can perform an economic drag on the portfolio, reducing performance to benchmark and peers. Using equity index futures can help a portfolio manager be more efficient and avoid the drag on performance created by the presence of cash in a portfolio. This process is known as cash equitization whereby futures replicate index returns and ensure the portfolio is fully invested, whilst still having cash available for managing flows in and out of the fund.
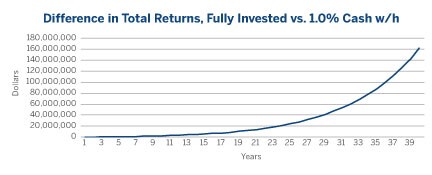
Consider a $100 million fund invested in equities but withholding 1.0% in uninvested cash. Assume an annualized rate of return of 10% over a forty-year period.
Difference in Total Returns, Fully Invested vs. 1.0% Cash w/h
Source: EIA
Source: CME Group
As the chart above indicates, even a small percentage of uninvested cash over time can have a significantly negative effect upon performance. In this example, over a 40-year investment horizon this equates to a variance of over $162 million, or roughly 3.6% less than the 100% invested portfolio. This negative result has serious implications for managers and fiduciaries of both public and private funds.
Can an investment portfolio achieve its benchmark objective while retaining a small portion of cash for operational purposes? Yes. The process used to remain fully invested using futures contracts is known as cash equitization (also known as cash securitization or cash overlay).
Constructing an Appropriate Cash Equitization Position
How many futures contracts are required to cover an uninvested cash position?
Going back to our original example, $100 million portfolio with 1.0% of uninvested cash, assume E-mini S&P 500 Index futures (ES) to be at 2650.00. Using the $50 multiplier we can quickly determine the notional value of an ES contract to be 2650.00 x $50 = $132,500 per contract. To arrive at the number of ES futures needed, take the dollar equivalent of uninvested cash and divide by the notional value of the ES contract.
For example, Contracts needed = $ value uninvested / NV of ES futures = $1,000,000 / 132,500 = 7.55 or rounded to a whole number, 8 ES contracts. The portfolio manager would buy 8 ES futures contracts to return the portfolio to a fully invested (99.0% in securities plus 1.0% in futures) level. Buying the ES contracts would require an initial margin (IM) deposit. Assuming an IM requirement of $6,600 per contract the initial capital outlay would be 8 contracts x $6,600 per contract = $52,800 for the position. This leaves $947,200 for operational purposes while remaining fully invested to the benchmark index.
Because cash will continuously flow in and out of the fund, and market levels will move over time, the contract amount may need adjusting periodically. The deep liquidity found in CME’s equity index futures suite, means that these flows in and out of the fund can be executed promptly to manage market exposure. Futures are also associated with low execution costs. Thus, futures are a very flexible instrument that can be deployed quickly in a cost-effective manner. This is unlike some underlying investments where adjusting a portfolio’s exposure may take time due to the investment’s less liquid nature or have high trading costs (via the bid-offer spread or in terms of trading commissions).
One point to note is that futures contracts have an expiration date, usually quarterly. Therefore, to maintain a constant open position requires rolling an open position forward to the next quarterly contract when the existing position approaches expiration.
Risk managers responsible for multiple funds may aggregate the uninvested cash of all their funds and create a comprehensive equitization overlay. Our example used E-Mini S&P Index 500 futures but other index futures may be more appropriate depending on the fund’s benchmark index. A sample of some of CME’s equity index futures contracts on benchmark indices are included in the table below.
| Benchmark | Futures contract | CME Symbol |
| S&P 500 Index | E-mini | ES |
| S&P 500 Index | Regular | SP |
| S&P MidCap 400 | E-mini | ME |
| Nasdaq-100 | E-mini | NQ |
| Russell 2000 Index | E-mini | RTY |
| Russell 1000 Value Index | E-mini | RSV |
| Nikkei 225 USD | Regular | NK |
| Nikkei 225 Yen | Regular | N1 |
| Topix Yen | Regular | TPY |
| FTSE China 50 Index | E-mini | FT5 |
Portable Alpha
Building on the concept of cash equitization is another common equity index futures strategy employed to create added value to the portfolio using the economic leverage embedded in futures along with a short-term risk-free interest rate instrument
to produce additional income to the fund. This technique is known as portable alpha. Remember, while equity index futures effectively replicate their underlying index they require less capital to do so. The residual capital can be employed in another interest bearing, income producing instrument which results in higher net returns to the fund. Let’s consider our previous example of a $100 million fund with 1% uninvested cash. What if the portfolio manager were to allocate an additional 10% of capital, equitized it using futures contracts, but instead of retaining the residual cash invested it in 3-month Treasury bills?
For this example, assume a 3-month Treasury bill rate of 2.40%. Using the same market inputs as our previous example we would want to convert 11%, or $11,000,000 to ES contracts.
11,000,000 / 132,500 = 83.01 rounded to 83 contracts. The PM would buy 83 ES contracts to remain fully invested to the fund’s level. Those contracts would need to be secured with margin, 83 x $6,600 per contract = $547,800 capital outlay. Subtracting the margin requirement from $11 million results in $10,452,200 in residual cash. Allowing for $947,200 to be withheld for operational purpose (previous example) the resulting cash available to invest in T-bills is $9,505,000.
What happens three months later? Assume for illustrative purposes that the equity index does not change. What is the financial effect of the income from the T-bills? Income = rate x days/360 x principal = 0.024 x 0.25 x $9,505,000 = $57,030. Without any gain or loss from the equity exposure the fund produced roughly 6 basis points of additional return. If annualized, it would be closer to 24 basis points.
While this is a simple example using a risk-free rate of return other income producing instruments could also be employed depending on the risk profile or investment guidelines of the fund which may result in even higher alpha generation.
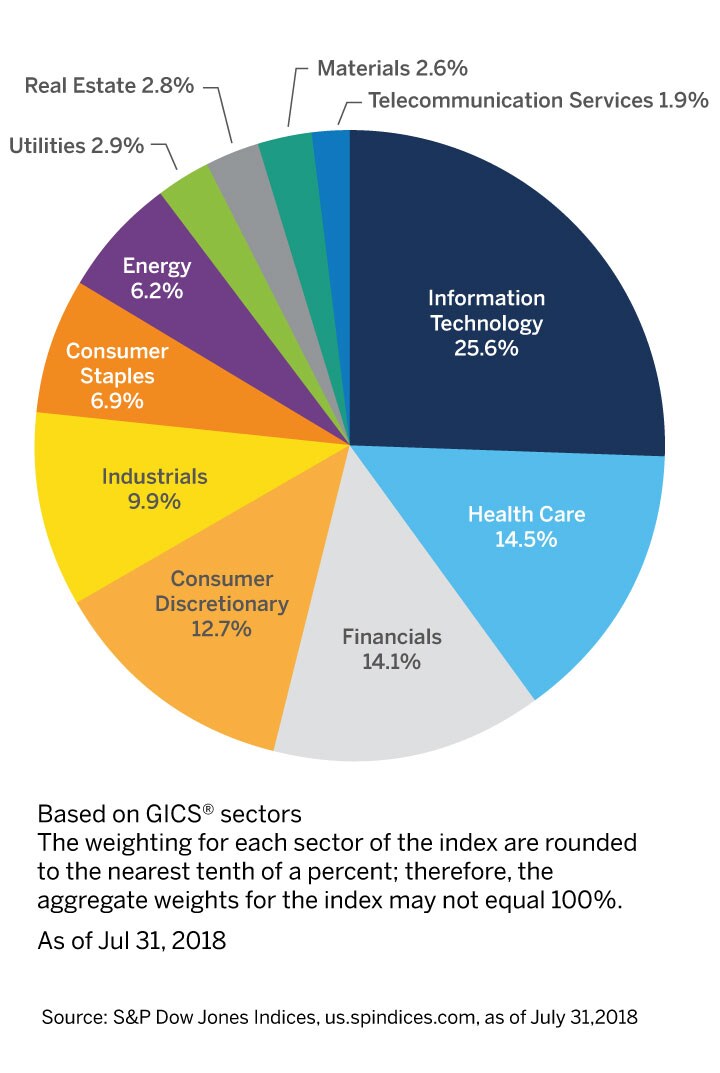
Sector Rotation
In addition to broad market indices like the S&P 500, Dow Jones Industrial Average, Russell 2000, and others CME Group also lists futures contracts on the sub-sector indexes of the S&P 500. Known as Select Sector futures these futures contracts are designed to track and trade like the underlying sectors of the S&P 500 Index. There are 11 Select Sector futures contracts: Utilities, Health Care, Materials, Consumer Discretionary, Consumer Staples, Industrials, Technology, Energy, Financials, Real Estate, and Communications.
| Sector | Index Value | Multiplier | Notional | Margin |
| Utilities | 546.30 | $100 | $54,630 | $1,815 |
| Health Care | 855.70 | $100 | $85,570 | $3,410 |
| Materials | 527.40 | $100 | $52,740 | $2,805 |
| Consumer Disc | 993.70 | $100 | $99,370 | $4,950 |
| Consumer Staples | 520.70 | $100 | $52,070 | $1,815 |
| Industrials | 649.40 | $100 | $64,940 | $3,575 |
| Technology | 627.60 | $100 | $62,760 | $3,960 |
| Energy | 588.70 | $100 | $58,870 | $3,850 |
| Financials | 289.30 | $250 | $72,325 | $4,070 |
| Real Estate | 154.55 | $250 | $38,638 | $1,265 |
| Communication | 220.00 | $250 | $55,000 | $3,520 |
Source: CME Group based on 19 December 2018 data
These contracts are constructed just like the broad index contracts in that they reference an index value and fix multiplier. Select Sector futures allow equity fund managers the ability to tilt, or rotate, risk toward or away from specific sector risk by buying or selling the appropriate futures contract.
Different sectors of the economy respond differently to changes in the flow of the business cycle or react differently to event risk shocks. Some sectors may either outperform or underperform others during certain phases of a cycle or in reaction to a particular market event.
How to construct a sector rotation trade?
Similar to an index futures trade, the amount of Select Sector futures to employ in a rotation strategy should consider the value of the risk and the notional value of the futures. Consider a $100 million portfolio pegged to the S&P 500 Index. The PM is concerned about falling prices of the benchmark index but particularly concerned that financials shares will drop proportionally more than utilities shares. Rather than reconfigure the entire portfolio which could take days and incur enormous transaction and market impact costs the PM elects to create this rotation strategy using Select Sector futures.
Assume a 5% of total capital rotation away from Financials into Utilities. In this case the value at risk is $5 million (5% of $100 million). Using the notional values from the table above we can now contrast the rotation trade using Select Sector futures.
Financials Select Sectors = 5,000,000 / 72,325 = 69.13 rounded to 69
Utilities Select Sectors = 5,000,000 / 54,630 = 91.52 rounded to 92
To create the sector rotation strategy using Select Sector futures the PM would sell 69 Financials futures and buy 92 Utilities futures. As reported by S&P Dow Jones Indices Quarter-to-Date (QTD) returns on the S&P 500 Index and the Sectors can be seen in the table below.
| Index | QTD |
| S&P 500 | -14.92% |
| Utilities | 3.79% |
| Real Estate | -2.49% |
| Communications | -13.82% |
| Consumer Staples | -5.38% |
| Materials | -14.88% |
| Info Tech | -18.60% |
| Consumer Disc | -18.94% |
| Health Care | -11.43% |
| Industrials | -18.54% |
| Financials | -15.12% |
| Energy | -24.61% |
Source: S&P Dow Jones Indices, Daily Index Dashboard, December 20, 2018
During this period, rotating 5% of the fund’s exposure away from Financials and into Utilities might have added value to the portfolio’s performance versus the return of the S&P 500 Index. Another important consideration of using futures as opposed to other sector referenced products like ETFs is the capital outlay required for each. ETFs require full payment upon execution. Going short a sector ETF requires a relationship with Prime Broker willing to lend the security for shorting. Shorting with an ETF incurs additional borrowing costs.
Selling futures is the same as going long, both simply require the performance bond to secure the open position. By being both long and short price correlated Select Sector futures the net position may be lower in market exposure than an outright long or short position. CME Clearing would view a highly correlated spread position from a net risk perspective and may grant a margin reduction depending on the spread. Greater capital efficiency results on greater return on capital.
Currency Risk
In all the examples in this note we have considered using USD denominated securities and derivatives. Whether an Australian fund chooses cash products or futures based on U.S. equity indexes there will be an element of foreign exchange, or currency risk added to the risk position. By investing directly in U.S. securities, the first transaction necessary in creating the position will be converting AUD to USD. Therefore, the Australian investor assumes two forms of market risk, U.S. equity market exposure, and USD/AUD exchange rate risk.
As has been stated repeatedly, futures do not require full payment for the equivalent notional risk position at execution. In addition to the economic leverage they imply they also expose the investor to lower foreign currency risk. By using or posting lower amounts of USD converted capital the Australian investor can have less currency risk. The full USD currency exposure could be added with a currency overlay strategy but that is optional rather than imposed as it would be in a fully funded cash product.
CME Group lists futures contracts based on currency pairs. Australian Dollar (6A) and New Zealand Dollar (6N) are two actively traded APAC currency pairs listed and cleared. Currency overlay strategies can be constructed using FX futures to either increase or decrease exposure versus USD.
Summary
Exchange listed and cleared derivatives provide Australian asset managers and funds with effective and capital efficient tools to help manage risk and create alpha in their fund management activities. CME Group is a global leader in derivative product development and clearing solutions that can provide real value to risk managers and traders worldwide. By providing deep pools of actionable liquidity across a wide array of asset classes CME’s Globex electronic market is the leading source of global price discovery and risk transfer.
- MSCI Inc., MSCI World Ex Australia Index, November 30, 2018
Standard & Poor’s, S&P®, S&P 500®, S&P-GSCI™, S&P-GSCI Spot Index™, S&P-GSCI Excess Return Index™, S&P-GSCI Total Return Index™, S&P-GSCI Non-Energy Excess Return Index™, S&P-GSCI Light Energy Excess Return Index™, S&P-GSCI Livestock Excess Return Index™, S&P-GSCI Industrial Metals Excess Return Index™, S&P-GSCI Energy Excess Return Index™, S&P-GSCI WTI Oil Excess Return Index™, S&P-GSCI Natural Gas Excess Return Index™, S&P-GSCI Grains Excess Return Index™, S&P-GSCI Agricultural Excess Return Index™, Standard & Poor’s®, Standard & Poor’s 500™, 500™, S&P 100®, Standard & Poor’s 100™, S&P MidCap 400™ Index, S&P SmallCap 600™ Index, S&P 500/CITIGROUP Growth Index™,S&P 500/CITIGROUP Value Index™, Standard & Poor’s 500/CITIGROUP Value Index™, S&P Energy Stock Price Index™, Standard & Poor’s Energy Stock Price Index™, Standard & Poor’s Financial Stock Price Index™, S&P High Technology Stock Price Index™, Standard & Poor’s High Technology Stock Price Index™, S&P Public Utility Stock Price Index™, Standard & Poor’s Public Utility Stock Price Index™, S&P Consumer Staple Stock Price Index™, Standard & Poor’s Consumer Staple Stock Price Index™, S&P Transportation Stock Index™, Standard & Poor’s Transportation Stock Price Index™, S&P Euro Index™, S&P Euro Plus Index™, S&P 500 GICS Sector Indices™, SPDR®, Standard & Poor’s Depositary Receipts™, S&P Asia™, Bxy Trakrs™ are trademarks of The McGraw-Hill Companies, Inc. and have been licensed for use by Chicago Mercantile Exchange Inc.
Neither futures trading nor swaps trading are suitable for all investors, and each involves the risk of loss. Swaps trading should only be undertaken by investors who are Eligible Contract Participants (ECPs) within the meaning of Section 1a(18) of the Commodity Exchange Act. Futures and swaps each are leveraged investments and, because only a percentage of a contract’s value is required to trade, it is possible to lose more than the amount of money deposited for either a futures or swaps position. Therefore, traders should only use funds that they can afford to lose without affecting their lifestyles and only a portion of those funds should be devoted to any one trade because traders cannot expect to profit on every trade.
CME Group, the Globe Logo, CME, Globex, E-Mini, CME Direct, CME DataMine and Chicago Mercantile Exchange are trademarks of Chicago Mercantile Exchange Inc. CBOT is a trademark of the Board of Trade of the City of Chicago, Inc. NYMEX is a trademark of New York Mercantile Exchange, Inc. COMEX is a trademark of Commodity Exchange, Inc. All other trademarks are the property of their respective owners.
The information within this communication has been compiled by CME Group for general purposes only. CME Group assumes no responsibility for any errors or omissions. Additionally, all examples in this communication are hypothetical situations, used for explanation purposes only, and should not be considered investment advice or the results of actual market experience. All matters pertaining to rules and specifications herein are made subject to and superseded by official CME, CBOT, NYMEX and COMEX rules. Current rules should be consulted in all cases concerning contract specifications.
Copyright © 2019 CME Group Inc. All rights reserved