Ultra-Liquid: TN Futures Set Open Interest Records in Q3 2020
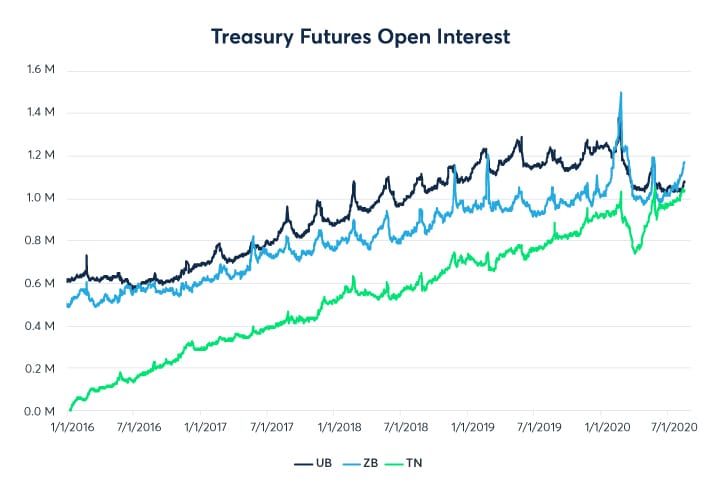
After four years of strong growth in liquidity metrics and increased Treasury issuance, a shift out the curve in pursuit of yield propelled the Ultra Ten-Year futures to new OI records in August 2020.
With more than one million open contracts heading into the Sep-Dec roll, this represents over $100 billion notional value and nearly $150 million in ongoing DV01 risk exposure
From late July through August 2020, Ultra 10-Year futures (TN) reached new open interest highs in the runup to the December roll and September delivery window. While Treasury futures open interest typically expands at the end of the quarterly cycle, the TN contract saw record after record fall, with nine of its ten highest in August alone and 23 of its top 25 in July and August.
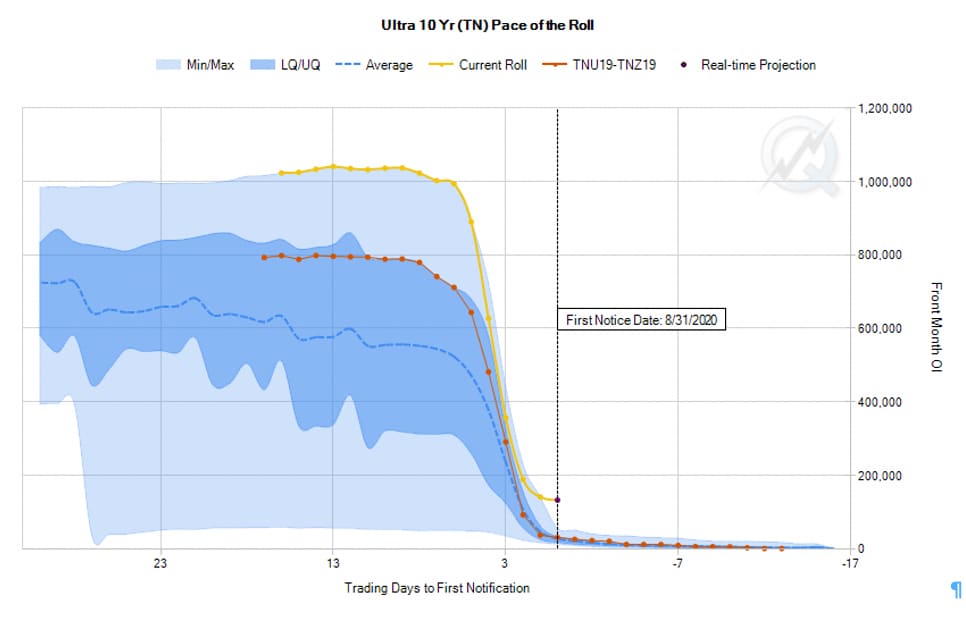
This situation lifted open interest to nearly 1.1 million contracts, exceeding levels reached during the March FOMC rate cuts and subsequent spike in market volatility. The Sep-Dec roll was by far the most active in the TN contract’s history, roughly doubling the average since its launch in 2016 and increasing activity significantly year over year, as shown by the Pace of the Roll1 tool.
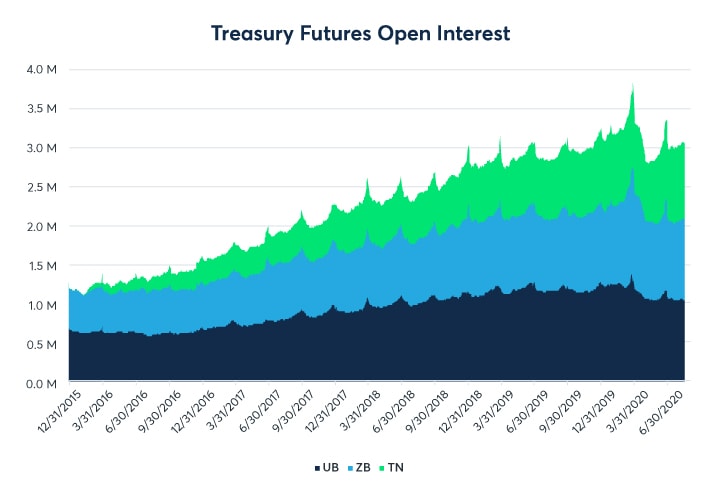
It also reflected the shift toward longer-dated instruments, with Classic and Ultra Long Bonds (ZB, UB) each around 1.1 million contracts in open interest. Together, these three contracts make up over $900 million in risk transfer as measured by DV01, the change in value for each basis point move in rates.
The need for hedging in longer tenors reflects the US Treasury’s shift further out into the curve as it issues unprecedented levels of debt. While short end auctions (the 2-year, 3-year, 5-year, and 7-year) have increased issuance sizes around 25% since the beginning of 2020, the long-term notes and bonds are up about 40%.
US Treasury Auction Sizes ($B)
| Auction Month | 2-year | 3-year | 5-year | 7-year | 10-year | 20-year | 30-year |
| Nov 2019 | 40 | 38 | 41 | 32 | 27 | 19 | |
| Dec 2019 | 40 | 38 | 41 | 32 | 24 | 16 | |
| Jan 2020 | 40 | 38 | 41 | 32 | 24 | 16 | |
| Feb 2020 | 40 | 38 | 41 | 32 | 27 | 19 | |
| Mar 2020 | 40 | 38 | 41 | 32 | 24 | 16 | |
| Apr 2020 | 42 | 40 | 43 | 35 | 25 | 17 | |
| May 2020 | 44 | 42 | 45 | 38 | 32 | 20 | 22 |
| Jun 2020 | 46 | 44 | 47 | 41 | 29 | 17 | 19 |
| Jul 2020 | 48 | 46 | 49 | 44 | 29 | 17 | 19 |
| Aug 2020 | 50 | 48 | 51 | 47 | 38 | 25 | 26 |
| Sep 2020 | 52 | 50 | 53 | 50 | 35 | 22 | 23 |
| Oct 2020 | 54 | 52 | 55 | 53 | 35 | 22 | 23 |
Source: Treasury refunding announcements
Add issuance from the reintroduced 20-year bond, and issuance in the back half of the US government bond curve is up over 80% compared to the start of 2020. Understandably, this has fed into speculation about what longer term yields will do in the face of continued debt growth and the subsequent need for hedging in futures from the 10-year point onward.
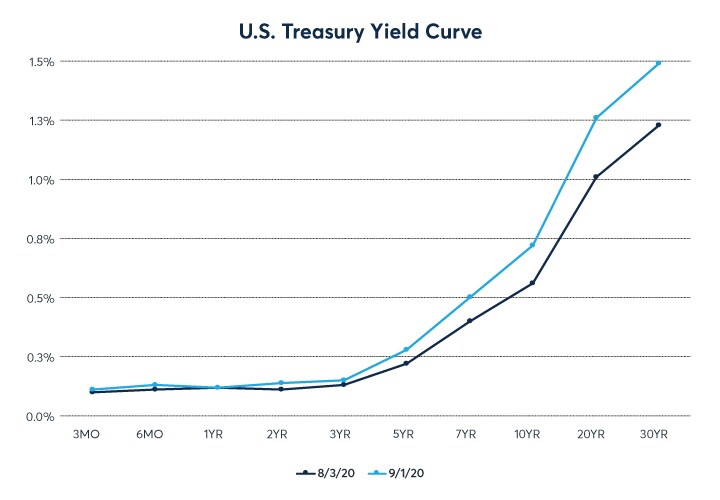
In yield terms, the 10- to 20-year portion of the curve maintains localized steepness2, likely reflecting two phenomena. The 20-year premium has existed since its May relaunch, and it makes sense ‒ given that it has not yet become as established a liquidity point as the 10-year or 30-year. The 10-year yield discount can be explained by its historical flagship position on the curve, but with the adjacent 7-year issuance growing much more rapidly, it remains to be seen how the shape of the 7- to 30-year region will react. Nevertheless, continued increases in issuance and risk transfer needs make this sector an important one to watch.
References
- Interest Rates Pace of the Roll: https://www.cmegroup.com/trading/interest-rates/paceoftheroll/
- Data from CME Group Treasury analytics: https://www.cmegroup.com/tools-information/quikstrike/treasury-analytics.html