Treasury Curve Trading ‒ 2020 Trends and Highlights
Treasury Curve Trading – 2020 Trends and Highlights
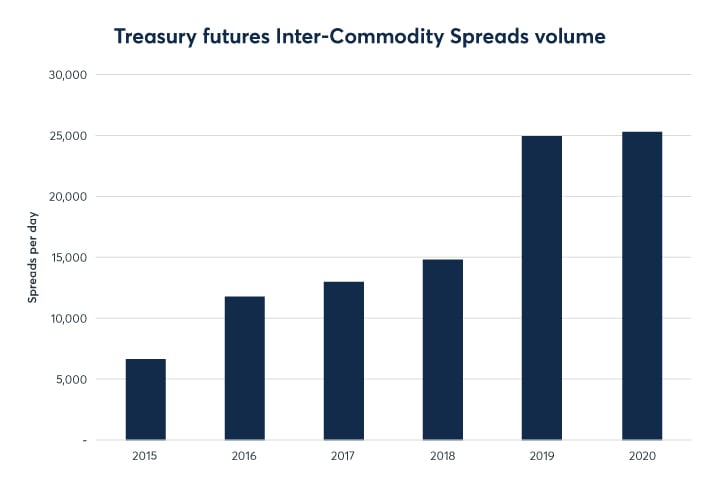
As an efficient tool for executing yield curve trades, Treasury Inter-Commodity Spreads (ICS) have seen marked growth in recent years.
Following a record 2019, daily ICS volume edged higher in 2020 as record coupon issuance helped to offset lower H2 volatility.
Treasury Inter-Commodity Spreads (ICS) at a glance
- ICS are pre-defined spreads between Treasury futures contracts listed on CME Globex.
- ICS allow traders to execute curve trades via a single transaction, eliminating slippage risk that could occur when legging such a spread.
- ICS offer automatic margin offsets, increased matching opportunities, and can reduce the noise of individual legs during volatile markets.
2020 trading highlights
Following a record 2019, daily ICS volumes edged higher in 2020 as record coupon issuance and a steepening of the yield curve drove yield curve hedging and relative-value trading further out on the curve.
Exhibit 1: Annual average daily spread volume in Treasury Inter-Commodity Spreads (2015 – 2020)
Source: CME Group
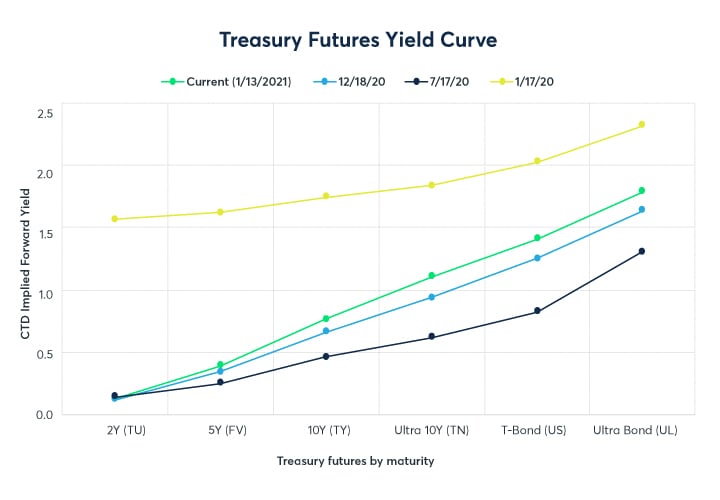
Exhibit 2: Treasury futures yield curve (17 January 2020 – 13 January 2021)
Source: CME TreasuryWatch Tool, powered by QuikStrike
Exhibit 3: ICS activity by spread (2020 vs. 2019)
| Spreads Traded Per Day | |||||
| Spread Name | Futures Contract Legs | Leg Ratio | 2020 | 2019 | % Chg. YoY |
| FYT | 5-Year vs. 10-Year | +3 ZF, -2 ZN | 7,052 | 8,534 | -17% |
| BOB | T-Bond vs. Ultra T-Bond | +2 ZB, -1 UB | 5,601 | 2,382 | +135% |
| TEX | 10-Year vs. Ultra 10-Year | +3 ZN, -2 TN | 4,196 | 3,306 | +27% |
| TUF | 2-Year vs. 5-Year | +5 ZT, -4 ZF | 2,392 | 2,368 | +1% |
| NCB | Ultra 10-Year vs. T-Bond | +5 TN, -3 ZB | 1,377 | 1,301 | +6% |
| NOB | 10-Year vs. T-Bond | +5 ZN, -2 ZB | 1,367 | 1,688 | -19% |
| TFY | 2-Year vs. 5-Year | +1 ZT, -1 ZF | 1,366 | 2,763 | -51% |
| NON | 10-Year vs. Ultra 10-Year | +1 ZN, -1 TN | 581 | 624 | -7% |
| TOF* | 3-Year vs. 5-Year | +1 Z3N, -1 ZF | 325 | - | n/a |
| FIT | 5-Year vs. 10-Year | +5 ZF, -3 ZN** | 307 | 207 | +48% |
| NUB | Ultra 10-Year vs. Ultra T-Bond | +3 TN, -1 UB | 151 | 138 | +9% |
| FIX | 5-Year vs. Ultra 10-Year | +5 ZF, -2 TN | 135 | 154 | -12% |
| TYT* | 2-Year vs. 3-Year | +3 ZT, -1 Z3N | 127 | - | n/a |
| TUT | 2-Year vs. 10-Year | +2 ZT, -1 ZN | 119 | 155 | -23% |
| FOB | 5-Year vs. T-Bond | +4 ZF, -1 ZB | 113 | 198 | -43% |
| TUN* | 3-Year vs. 10-Year | +3 Z3N, -2 ZN | 19 | - | n/a |
| TYX* | 3-Year vs. Ultra 10-Year | +2 Z3N, -1 TN | 11 | - | n/a |
Source: CME Group
*For ICS involving 3-Year futures, 2020 volume calculated from July 13 – Dec 31, 2020
**FIT leg ratio changed to 2:1 beginning with Mar-2021 contract
Product Code Legend: 2-Year (ZT), 3-Year (Z3N), 5-Year (ZF), 10-Year (ZN), Ultra 10-year (TN), T-Bond (ZB), Ultra T-Bond (UB)
5s over 10s remain most active
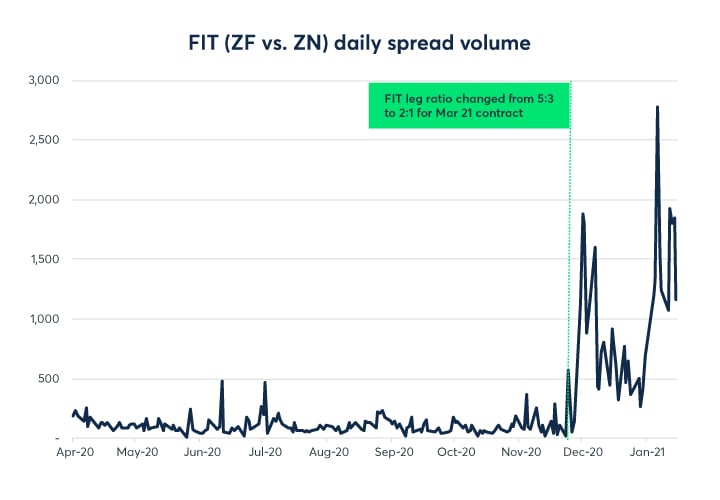
Propelled by a record first quarter, the FYT (+3 ZF, -2 ZN) spread remained the most actively traded ICS in 2020. Meanwhile, the lesser known 5s over 10s FIT spread saw trading volume spike in December following a change to the leg ratio from 5:3 to 2:1, a trend that has continued in early 2021. CME Group lists multiple ratio options for each Treasury spread, giving clients the flexibility to choose the instrument best suited to their risk management or trading needs.
Exhibit 4: FIT daily spread volume (1 April 2020 – 15 January 2021)
Source: CME Group
Bond vs. Ultra Bond spreading surges as long-end coupon issuance doubles YoY
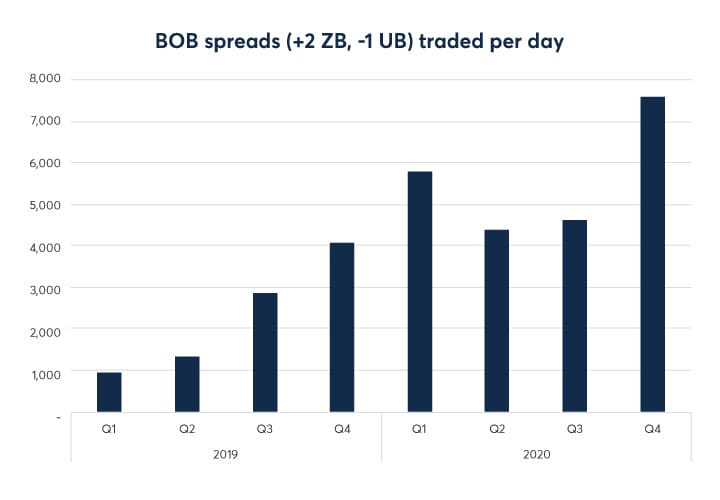
With the US Treasury taking meaningful steps to extend its maturity profile in 2020, long-end Treasury futures, and long-end curve spreads by extension, saw trading activity rise to record levels. In addition to a record $251B in gross 30-year issuance, the Treasury’s reintroduction of the 20-year bond for the first time since 1986 added $171B in long bonds – together more than doubling long-end coupon issuance vs. 2019 ($422B in 2020 vs. $204B in 2019). The 20-year’s arrival was especially impactful with eligibility for delivery into the Classic Bond’s delivery basket and a unique position sitting nearly squarely in between the Classic Bond’s (ZB) CTD and the Ultra Bond’s (UB) CTD.
As a result, Bond vs. Ultra Bond (BOB) spread volume surged 135% YoY, becoming the most actively traded ICS instrument in the second half of 2020.
Exhibit 5: Quarterly average daily spread volume in BOB spreads (2019 – 2020)
Source: CME Group
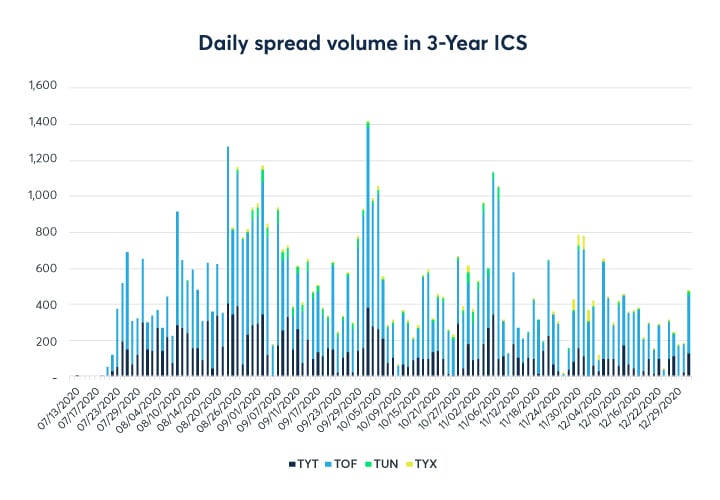
New opportunities at the 3-year point on the curve
The July 13, 2020 relaunch of 3-Year Treasury Note futures brought exciting new relative value opportunities to the short-end of the Treasury futures curve, with active trading across four new 3Y ICS instruments. While most of the trading focused on 2Y vs. 3Y (TYT) and 3Y vs. 5Y (TOF) spreads, 3Y vs. 10Y (TUN) and 3Y vs. Ultra 10Y (TYX) spreads have seen growing activity. Read our previous article here to learn more about yield curve spread opportunities created by the addition of 3-Year futures.
Exhibit 6: Daily spread volume in 3-Year ICS instruments (13 July 2020 – 31 December 2020)
Source: CME Group
Treasury Inter-Commodity Spreads – The details
Mechanics and pricing
- “Buying the spread” refers to buying the front leg and selling the second leg (a steepener).
- Spreads trade in exchange-defined ratios:
- The front leg is the contract with the shorter maturity.
- Quantity ratios are established quarterly based on futures DV01 using the respective cheapest-to–deliver securities. Ratios are expected to remain unchanged throughout the contract’s listing cycle.
- Price ratios equal the front leg quantity divided by the deferred leg quantity. The price ratio of spreads that include 2-Year and 3-Year T-Notes are doubled to account for its notional size ($200,000) is twice that of the other Treasury futures contracts
- Minimum spread tick is equal to that of the minimum tick of the front leg of the spread.
- Components of the spread trade have the same expiration month and year:
- June 2020 5-Yr T-Note vs. June 2020 10-Yr T-Note
- External name: FYT 03-02 M0
- Quantity Ratio: 3:2 Price Ratio = 1.5000
- Pricing convention is “net change on day”, see pricing example below for an illustration.
Listing and trading
- Deferred month spreads will be listed midway through the month prior to a contract expiration month. For example, September ICS will be listed in mid-May and will join the existing June spreads.
- All spreads are eligible to trade until expiration day of whichever leg expires first.
Order type specifications
- Good Till Cancelled (GTC) and Good Till Date (GTD) order qualifiers not supported.
- Spread type: IV
Matching
- Implied outrights created by ICS have FIFO priority.
- Defined spread orders will take precedence over implied orders at a given price.
Market data
- Generally, only first generation implied “in” market data is disseminated.
- Implied “out” prices on ICS legs are not disseminated.
- EXCEPTION: Implied “out” market will be displayed for spreads with 1:1 quantity ratios.
Trade matching process
If available, incoming ICS orders match with existing ICS orders at the required price. Otherwise, CME Globex will “leg” the spread order.
1. The ICS matches with a resting ICS order at the same or better price.
- In these cases, leg prices are allocated such that net change in the front leg matches the net change of the spread price. The assigned price of the back leg matches the settlement price of the previous day (unchanged).
2. If a match isn’t available in the spread book, CME Globex will look to the constituent leg prices to see if there is a potential match.
- In cases where Globex “legs” the order, the spread order will be executed at the most advantageous differential possible, which may be better than the price on the incoming order
- Significance: while ICS prices are disseminated and orders entered at “standard” (.25, .50, .75, 1.0) tick increments, ICS orders are frequently matched at bid/ask spreads narrower than “standard” tick increments
Treasury ICS pricing example
FYT 03-02 M0 (5-Year T-Note vs. 10-Year T-Note)
- Quantity Ratio: 3:2 Spread
- Quantity: 200
- Price Ratio: 1.5000
| Prior-Day Settle Price | Current Price | Net Change | Leg Quantity | |
| FVM0 | 123-14.5 | 123-06 | -8.5 | 600 |
| TYM0 | 131-13 | 131-00 | -13 | 400 |
Spread Price = (-8.5) – (-13/1.5000) = 0.1667/32nd
How do I measure the profit/loss from this trade?
The dollar change in the spread from the previous day’s settlement price is equal to:
| Spread Price | x | $ Value of 1/32nd | x | # front leg contracts | = | P&L | |
| If the trade takes place on the bid price (0.00) | 0/32nd | x | $31.25 | x | 600 | = | $0.00 |
| If the trade takes place on the ask price (0.25) | 0.25/32nd | x | $31.25 | x | 600 | = | $4,687.50 |
View our full ICS offering
Inter-Commodity spreads are available on Treasury futures, Short-Term Interest Rate futures, and Eris Swap futures.
Treasury ICS Analytics tool
For each Treasury ICS instrument, view the current price/leg spread ratio as well as its index value, yield spread, and hedge ratio for the prior settle and on an intra-day basis.