https://www.cmegroup.com/content/dam/cmegroup/education/images/2016/spreading-ultra-10-720x100.jpg
Spreading Ultra 10 Against Foreign Sovereign Bond Futures
Spreading Ultra 10-Year U.S. Treasury Note Futures Against Foreign Sovereign Bond Futures
The addition of Ultra 10-Year US Treasury Note (“TN”) futures to the exchange’s Treasury futures suite opens the door to significantly finer precision when utilizing futures to spread the 10-year point of the Treasury yield curve against the equivalent point on foreign sovereign yield curves. In this note, we discuss the structure of TN’s deliverable basket, the degree of correlation between price dynamics of TN futures and those of German, UK, Canadian, Japanese and Australian 10-year sovereign debt futures, and how a market participant can take advantage of these correlative relationships to make relative value trades.
Benefits of Capturing Spreads with Futures
Sovereign debt futures can be utilized to create or hedge exposures to government issued public credit risk in a similar manner to cash securities, while imparting the benefits of futures versus their cash equivalents.
Futures spreads require posting of relatively modest amounts of performance bond. By comparison, those who create spread positions with cash bonds must contend with fluctuations in repo financing rates, as well as with the inherent risks of repo settlement fails. Additionally, spread traders who utilize futures may benefit from performance bond offsets against positions they may carry in other interest rate futures cleared by CME Clearing. Examples of offsets for Ultra 10-Year Note Treasury futures against other CME-cleared interest rate futures appear in the table below:
CME Clearing Margin Offsets for TN Futures*
| Product | Margin Offset vs TN |
| 5-Year DSF | 65% |
| 7-Year DSF | 70% |
| 10-Year DSF | 75% |
| 20-Year DSF | 65% |
| 30-Year DSF | 60% |
| 2-Year Note Future (TU) | 50% |
| 5-Year Note Future (FV) | 70% |
| 10-Year Note Future (TY) | 80% |
| Classic Bond Treasury Future (US) | 70% |
| Ultra Bond Treasury Future (UB) | 70% |
| Eurodollar Future | Up to 70% |
*As of 7/5/2016
In addition to the capital efficiencies of futures, increasing demand for off-balance sheet Treasury exposure, combined with the potential for cash security settlement fails and the transparency of futures markets have brought Treasury futures liquidity to levels comparable, if not superior, to liquidity found in cash bond markets.
TN Futures: What do They Track?
An expiring TN contract is fulfilled by physical delivery of recently issued 10-Year US Treasury notes with remaining terms to maturity (“RTM”) no less than 9 years and 5 months, and no greater than 10 years. Given the economics of the Treasury futures delivery mechanism, TN’s price dynamics tend to track roughly the 9-1/2 year point on the Treasury yield curve when market yields are under 6%, and the 10-year point when market yields are above 6%. In either environment, the RTM of the Treasury note that is cheapest-to-deliver (“CTD”) into TN is close enough to 10 years to make TN a reasonably precise tool for hedging or relative-value spreading strategies.
TN, Bunds, Long Gilts, CGBs, JGBs and XMs
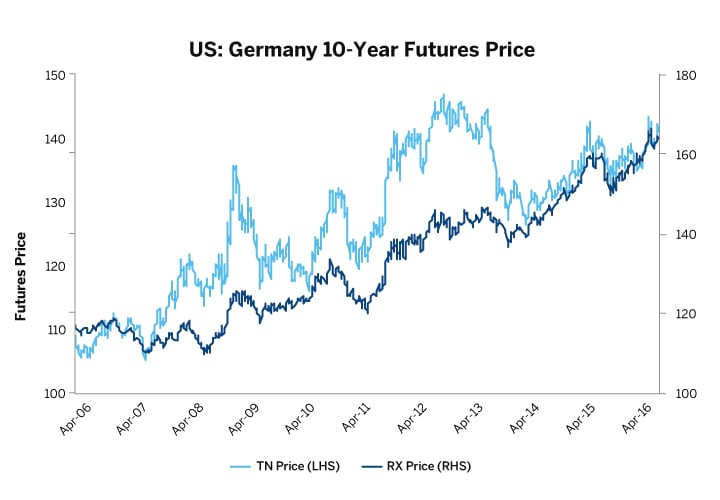
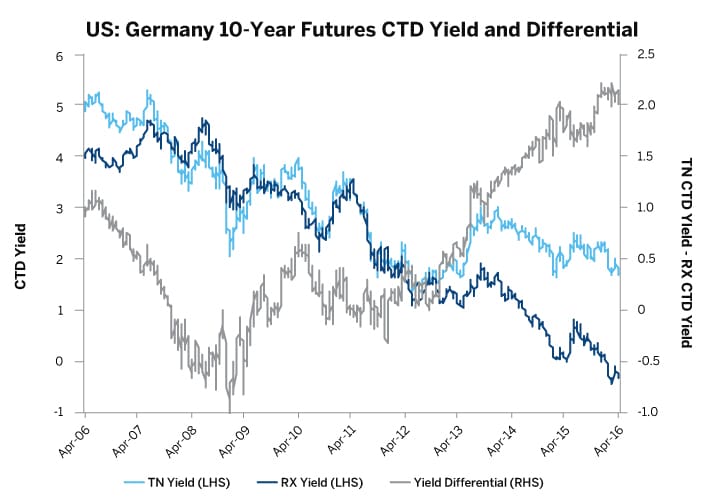
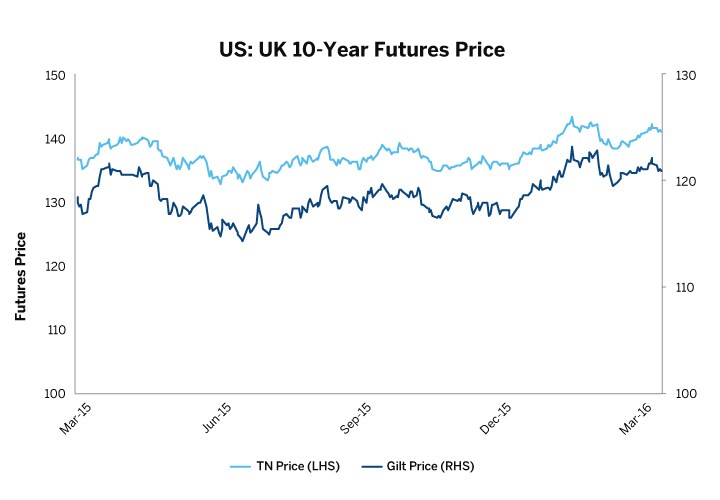
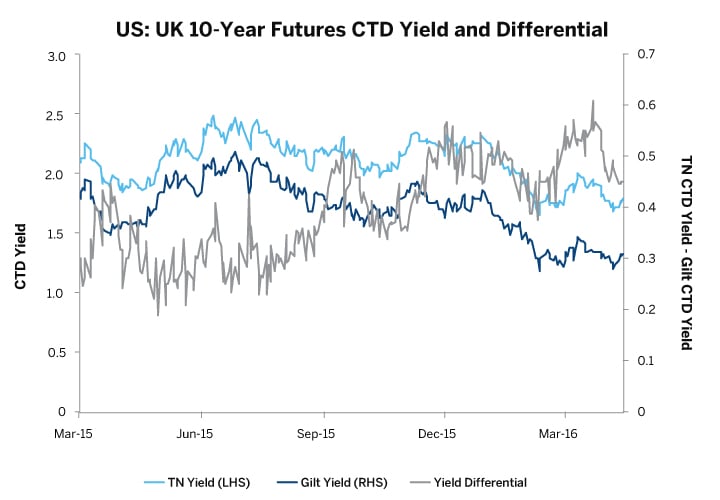
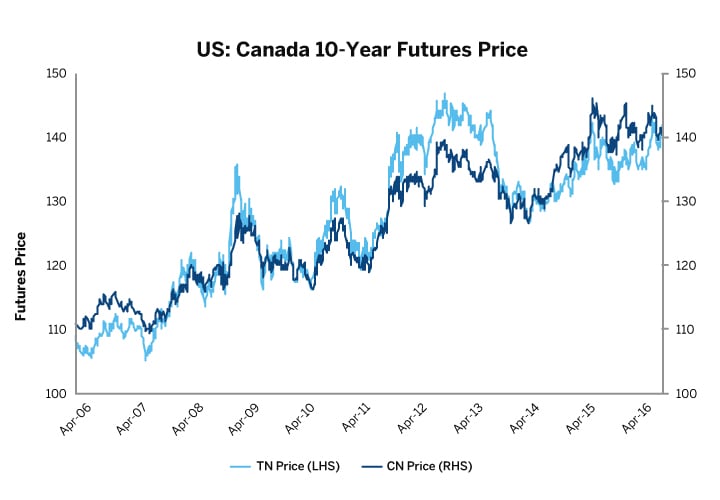
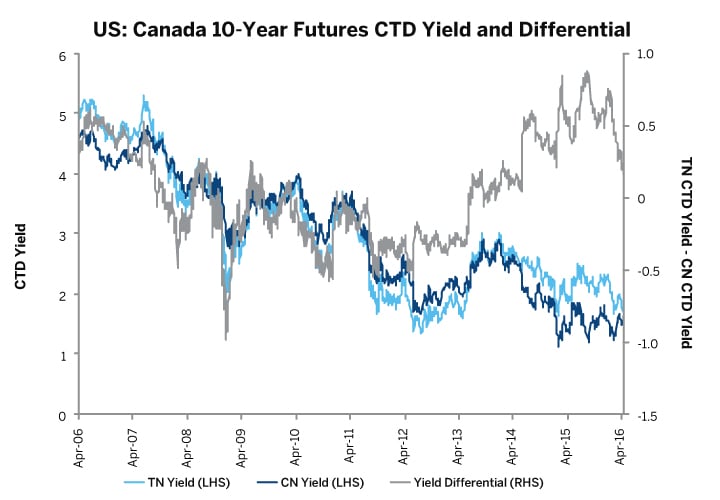
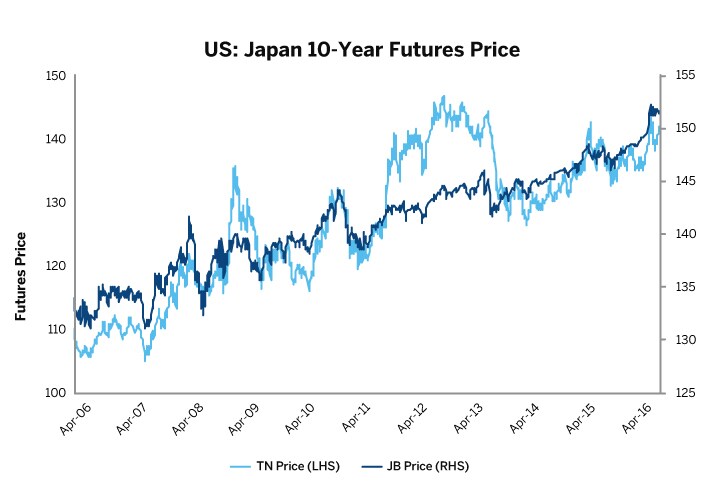
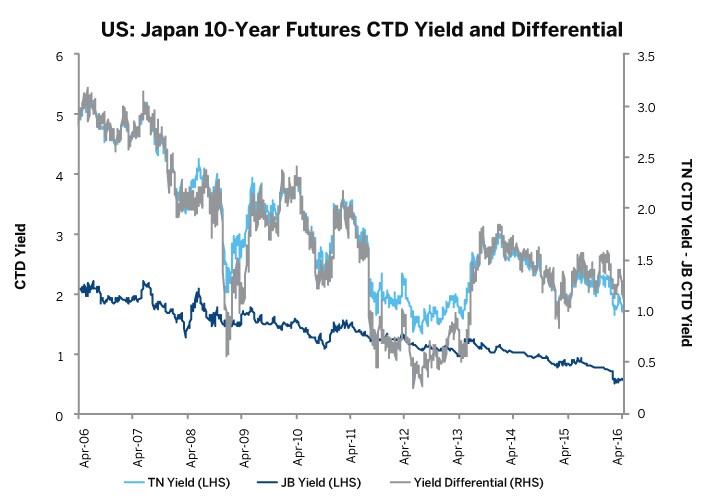
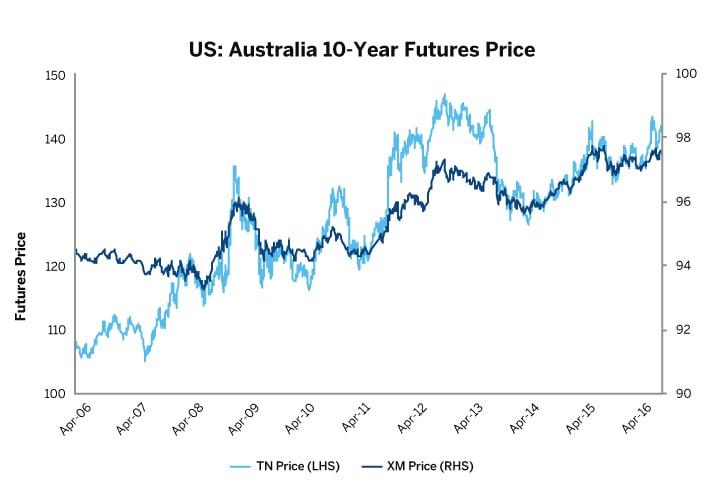
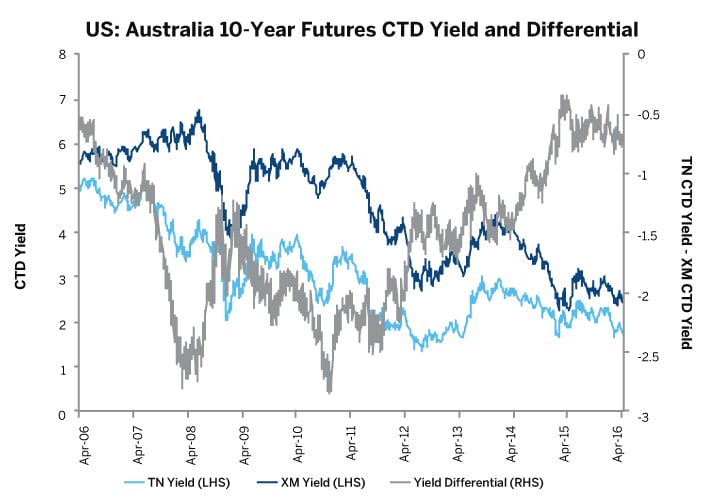
Exhibits 1-5 indicate how price action in TN and the yield of the underlying cheapest-to-deliver (“CTD”) 10-Year Note might have correlated with that of five comparable sovereign debt futures: Eurex Euro-Bund (RX) futures, ICE Long Gilt futures, TMX Ten-Year Government of Canada Bond (CN) futures, JPX 10-Year JGB futures (JB) and ASX 10-Year Bond futures (XM). Each depicts hypothetical fair-value estimates of daily settlement prices for nearby TN against actual daily settlement prices of the other sovereign debt contract, and the yields of the respective underlying CTD securities, from January 2005 through January 2016 for RX, CGB, JB, and XM, and from March 2015 through April 2016 for Long Gilt futures.
Given the correlative relationships among these six contracts, any price move in one that opens an abnormally large or small price differential relative to another may present an alert relative-value trader with an opportunity.
Contract Specifications – TN, RX, CN, Gilt, JB, and XM
| TN | RX | CN | Gilt | JB | XM | |
| Unit Size | $100,000 | €100,000 | C$100,000 | £100,000 | ¥100,000,000 | A$100,000 |
| Min Px Chng | ½ of 1/32nd | 0.01 | 0.01 | 0.01 | 0.01 | 0.005 |
| Contracts | 3 Mar Quarterly Cycle | 3 Mar Quarterly Cycle | 4 Mar Quarterly Cycle | 3 Mar Quarterly Cycle | 3 Mar Quarterly Cycle | 3 Mar Quarterly Cycle |
| Deliverable Grade RTM | 9Y5M-10Y | 8Y8M-10Y | 8Y-10Y6M | 8Y9M-13Y | 7Y-11Y | Cash Settled |
| Delivery Date | Any business day within expiry month | 10th calendar day of expiry month | Any business day within expiry month | Any business day within expiry month | By 20th of expiry month | Business day following last trading day |
| Last Trading Day | 7th business day prior to last business day in expiry month | 2 exchange days prior to the delivery day of the relevant maturity month | 7th business day prior to last business day in expiry month | 2 business days prior to last business day in expiry month | 5th business day prior to the 20th | 15th day of contract month |
Exhibit 1—Futures Price and CTD Yield: TN and RX
https://www.cmegroup.com/content/dam/cmegroup/education/images/2016/spreading-ultra-10-against-foreign-sovereign-bond-futures.html-01-720x500.jpg https://www.cmegroup.com/content/dam/cmegroup/education/images/2016/spreading-ultra-10-against-foreign-sovereign-bond-futures.html-02-720x500.jpg
Exhibit 2—Futures Price and CTD Yield: TN and Gilts
https://www.cmegroup.com/content/dam/cmegroup/education/images/2016/spreading-ultra-10-against-foreign-sovereign-bond-futures.html-03-720x500.jpg https://www.cmegroup.com/content/dam/cmegroup/education/images/2016/spreading-ultra-10-against-foreign-sovereign-bond-futures.html-04-720x500.jpg
Exhibit 3—Futures Price and CTD Yield: TN and CN
https://www.cmegroup.com/content/dam/cmegroup/education/images/2016/spreading-ultra-10-against-foreign-sovereign-bond-futures.html-05-720x500.jpg https://www.cmegroup.com/content/dam/cmegroup/education/images/2016/spreading-ultra-10-against-foreign-sovereign-bond-futures.html-06-720x500.jpg
Exhibit 4—Futures Price and CTD Yield: TN and JGB
https://www.cmegroup.com/content/dam/cmegroup/education/images/2016/spreading-ultra-10-against-foreign-sovereign-bond-futures.html-07-720x500.jpg https://www.cmegroup.com/content/dam/cmegroup/education/images/2016/spreading-ultra-10-against-foreign-sovereign-bond-futures.html-08-720x500.jpg
Exhibit 5—Futures Price and CTD Yield: TN and XM
https://www.cmegroup.com/content/dam/cmegroup/education/images/2016/spreading-ultra-10-against-foreign-sovereign-bond-futures.html-09-720x500.jpg https://www.cmegroup.com/content/dam/cmegroup/education/images/2016/spreading-ultra-10-against-foreign-sovereign-bond-futures.html-10-720x500.jpg
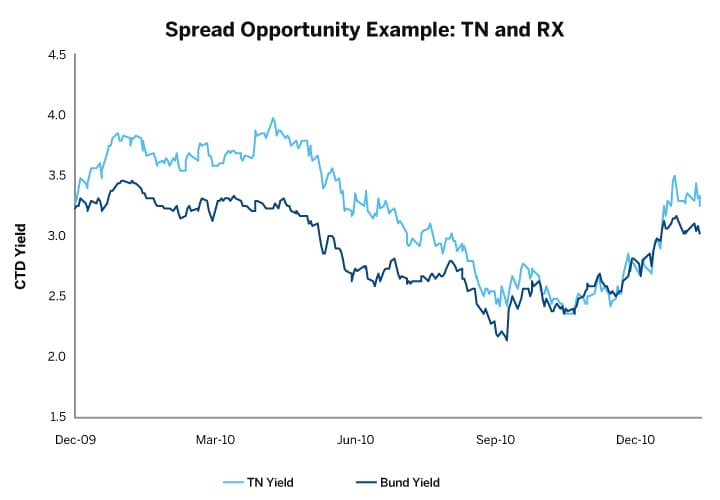
Exhibit 6—Spread Opportunity Example: TN and RX
Expressing a View on Relative Value
An example of this type of trade, using hypothetical nearby TN CTD yields and historical nearby RX CTD yields, is illustrated in Exhibits 6 and 7.
Exhibit 6 illustrates a period in which TN’s yield rose relative to RX’s. Historical analysis of RX and TN prices and yields -- shown in Exhibit 1 – suggests the presence of a correlative relationship between the two contracts, such that any widening of price or yield spreads between them might reasonably be viewed as temporary.
With this in mind, assume it is 28 December 2009, and consider a market participant who holds a long cash position in 10-Year Bunds, which he is either unwilling or unable to sell. Despite this constraint, he wants to position himself in anticipation of a reversion to the normal spread relationship between RX and TN. He considers two scenarios:
- Both RX prices and cash 10-Year Bund prices eventually decline in alignment with TN’s price movement.
- TN price will close the gap by rebounding.
With the first of these two scenarios in mind, he would like not only to position himself for a prospective narrowing of the RX-TN price spread, but also to hedge his cash Bund exposure against the possibility that it might decline in value. He concludes that the prudent course is to construct an interexchange spread by selling March 2010 RX futures and buying March 2010 TN futures. By taking a long-term view on German and U.S. government yields, moreover, he is also taking a stance on the EUR/USD exchange rate. If he felt there was a risk of significant FX volatility, he could cover this risk with FX futures; for the sake of simplicity, we’ll focus here on the government debt elements of the trade, and adjust the spread ratio on a DV01-weighted and FX-translated basis throughout the rolls.
Determining the Spread Ratio
For the market participant’s futures spread position to do the intended job, it should generate profit or loss only if a move in market price levels leads to a change in the 10-Year Treasury-Bund yield spread. For this, he structures the spread so that the price value of a 1-basis-point change in market yields (“PV01”) on one leg is equal in magnitude to the PV01 on the opposing leg.
On 28 December 2009, PV01 was $94.91 per contract for the hypothetical March 2010 TN futures contract (TNH0) and €92.85 per contract for the March 2010 RX futures. The prevailing level of the foreign exchange rate was 1.4378 USD per EUR.
With these elements in hand, the market participant determines that the appropriate PV01-weighted spread ratio is 1.41 TN contracts per RX contract (equal to
$133.491/$94.91). That is, to keep his spread strategy invariant to market movements other than those that result in a change in the 10-Year Treasury-Bund yield spread, he will purchase 141 TN contracts for every 100 RX contracts he sells. (Equivalently, he will sell 71 RX contracts for every 100 TN that he buys.)
Rolling the Position
The market participant deploys this strategy with a strategic time horizon in view. Accordingly, he rolls the position twice, in February 2010 (to supplant his March 2010 contracts with June 2010 contracts), and again in May 2010 (to roll his June 2010 contracts into September 2010 contracts). In each futures product, he rolls into the successor contract approximately a day before the first notice day of the expiring nearby contract.
At each roll, moreover, he rebalances the PV01 weighting of his spread position as outlined below:
| Date | Contract | DV01 | FX Rate | ||
| Mar:Jun Roll | |||||
| 26-Feb | RXM10 | 92.80 | 1.3631 | ||
| 26-Feb | TNM10 | 98.57 | 1 | ||
| New PV01 Neutral Spread Ratio: | 1.2835 | ||||
| Jun:Sep Roll | |||||
| 28-May | RXU10 | 101.02 | 1.2273 | ||
| 28-May | TNU10 | 99.98 | 1 | ||
| New PV01 Neutral Spread Ratio: | 1.2401 | ||||
Results
Between 2009 year-end and mid-August 2010, both German and US government securities markets have rallied. Given this, and given that the risk of decline in cash 10-year German government bonds has abated, the market participant decides to unwind his RX-TN futures spread.
Exhibit 7—RX:TN Futures Spread Positions
| Date | Action | Contract | Contracts | Price |
| 12/28/09 | Sell | RXH10 | 100 | 121.42 |
| Buy | TNH10 | 141 | 117-7/32 | |
| Feb-10 | Buy | RXH10 | 100 | 124.45 |
| (Roll 1) | Sell | TNH10 | 141 | 120-3.5/32 |
| Sell | RXM10 | 100 | 122.98 | |
| Buy | TNM10 | 128 | 119-9/32 | |
| May-10 | Buy | RXM10 | 100 | 128.5 |
| (Roll 2) | Sell | TNM10 | 128 | 123-6.5/32 |
| Sell | RXU10 | 100 | 127.96 | |
| Buy | TNU10 | 124 | 123-8/32 | |
| 8/16/10 | Buy | RXU10 | 100 | 132.05 |
| Sell | TNU10 | 124 | 131-1/32 |
Exhibit 8—Euro-Bund:TN Futures Spread Profit/Loss
| P/L (Points per Contract) | Contracts | |
| RX Roll 1 | -3.03 | 100 |
| RX Roll 2 | -5.52 | 100 |
| RX 16 Aug 2010 | -4.09 | 100 |
| Net Loss | -€1,264,000 | |
| TN Roll 1 | 2-28.5/32 | 141 |
| TN Roll 2 | 3-29/32 | 128 |
| RX 16 Aug 2010 | 7-25/32 | 124 |
| Net Gain | $1,874,000 |
He closes his short position of 100 September 2010 Bund futures, and he liquidates his long position in September 2010 TNU10. Exhibit 7 summarizes the positions into which he enters. Exhibit 8 summarizes the resultant profit and loss.
| Profit/Loss | FX EUR:USD | Total (USD) | |
| RX | -€1,264,000 | 1.2827* | -$1,621,332.80 |
| TN | $1,874,000 | 1 | $1,874,453.12 |
| Net Profit: | $253,120.32 |
*EUR:USD exchange rate effective for 8/16/2010.
- The overall price increase of 12.64 points per contract generates a cumulative loss on the short position in RX futures of $1,621,332.80.
- TN prices have also increased, leading the long position to profits of $1,874,453.12.
Our market participant converts his losses on the RX leg at 1.2827 USD per EUR USD on 16 August, making a net profit of $253,120.32. (For ease of presentation, the profit/loss reckoning excludes commissions, exchange fees, and trading costs entailed in crossing the bid/ask spread). In one trade strategy, he has successfully hedged his position in 10-year cash German government bonds and profited on his anticipation of a narrowing in yield spread between 10-year US and 10-year German government securities.
Featured Products
Take advantage of a more efficient way to trade 10-year Treasury exposure.