How Location Differentials are Determined in Soybean Oil and Soybean Meal
Each September, CME Group announces changes to the location differentials in the Soybean Oil and Soybean Meal futures contracts. Because differentials change over time, CME Group adopted this annual adjustment mechanism as the best attempt to keep futures delivery differentials in line with cash market prices, relative to the par delivery location. The annual adjustment mechanism only triggers if the cumulative weekly average number of receipts/certificates outstanding is greater than 150. The cumulative weekly average of outstanding shipping certificates is not public, but the market can monitor the Deliverable Commodities Under Registration and track the number of outstanding shipping certificates at any given time.
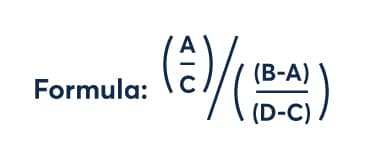
The differentials are determined by a formula that calculates the ratio between outstanding receipts and crushing capacity over the course of an observation period. That observation period runs from September 1 to August 31 for Soybean Meal and from January 1 to August 31 for Soybean Oil. Every week, the ratios are calculated for all delivery locations in both oil and meal. Updated ratios are posted in the Deliverable Commodities Under Registration report so that market participants can track the potential for changes in location differentials that would be implemented on January 1 of the following calendar year.
The calculation contains four variables which are listed below:
- Sum of all outstanding receipts in a territory
- Sum of all outstanding receipts in all territories
- Maximum 24-hour crushing capacity in a territory
- Maximum 24-hour crushing capacity in all territories
The formula calculates the ratio of outstanding shopping certificates in a given territory to the Chicago Board of Trade (CBOT) maximum 24-hour production capacity within that same territory, relative to the same ratio for the combined remaining territories. Generally, the methodology rebalances differentials so that the number of outstanding shipping certificates relative to production capacity will be roughly equal across all territories. For example, if a territory has a very low number of outstanding certificates relative to that territory’s production capacity compared to all the other territories, the ratio for that territory will be very low. Deliveries from that territory will receive a premium in the next January update to make delivery more valuable. Conversely, if a territory has a significant number of outstanding receipts relative to its production capacity compared to all the other territories, the ratio will be large. Deliveries from that territory will receive a discount in the next January update.
At the end of August each year we observe the ratios for each territory:
- For all territories, excluding the par territory, if the ratio is greater than or equal to 2.0 a discount is given to that territory. Conversely, if the ratio is less than or equal to 0.5, a premium is given to that territory. If the ratio is greater than 0.5 but less than 2.0, there is no change in the territory differential.
- If the par territory ratio is greater than or equal to 2.0, a premium is given to all other territories. Likewise, if the par territory ratio is lower than or equal to 0.5, a discount is given to all territories. Finally, if par territory ratio is greater than 0.5 but less than 2.0 ‒ there is no effect on the other territories’ differentials.
Given the above, there are several scenarios that could play out in each product ‒ given the cumulative weekly average number of receipts/certificates outstanding is greater than 150:
- No location has a ratio under 0.5 or above 2.0, and the delivery location differential remains unchanged.
- The par location has a ratio between 0.5 and 2.0, and one or more non-par territories have a ratio below 0.5 and over 2.0.
- The non-par territories with a ratio between 0.5 and 2.0 will remain unchanged.
- The non-par territories with a ratio under 0.5 will receive a premium effective at the start of the calendar year.
- The non-par territories with a ratio over 2.0 will receive a discount effective at the start of the calendar year.
- The par location has a ratio under 0.5, and one or more non-par territories have a ratio under 0.5 and/or above 2.0.
- The non-par territories with a ratio between 0.5 and 2.0 will receive a discount effective at the start of the calendar year.
- The non-par territories with a ratio under 0.5 will remain unchanged, as they would have received a premium which was negated by the par territory’s discount.
- The non-par territories with a ratio over 2.0 will receive two discounts effective at the start of the calendar year.
- The par location has a ratio over 2.0, and one or more territories have a ratio under 0.5 and/or above 2.0.
- The non-par territories with a ration between 0.5 and 2.0 will receive a premium effective at the start of the calendar year.
- The non-par territories with a ratio under 0.5 will receive two premiums effective at the start of the calendar year.
- The non-par territories with a ratio over 2.0 will remain unchanged, as they would have received a discount which was negated by the par territory’s premium.
For Soybean Oil, the premium/discount is 10 cents per hundredweight. Therefore, the maximum change in the location differential for each territory is 20 cents per hundredweight per year.
For Soybean Meal, the premium/discount is $1.00 per ton. Therefore, the maximum change in the location differential for each territory is $2.00 per ton.
The below illustrates two scenarios and how location differentials would be impacted. The green shading represents a premium, and the red shading represents a discount. The yellow shading represents the ultimate change to the differential.
Example 1:
SOYBEAN OIL FUTURES
| EASTERN | EASTERN IOWA | ILLINOIS (PAR) | NORTHERN | SOUTHWEST | WESTERN | |
| Ratio: | 6.535 | 0.800 | 0.677 | 1.023 | 0.000 | 1.629 |
| Par Change: | No Change | No Change | No Change | No Change | No Change | No Change |
| Non-Par Change: |
Discount 10¢ [background-color: #ffe2e4] |
Premium 10¢ [background-color: #e7f2e5] |
||||
| Conclusion: |
Discount 10¢ [background-color: #feffe8] |
No Change [background-color: #feffe8] |
No Change [background-color: #feffe8] |
No Change [background-color: #feffe8] |
No Change [background-color: #feffe8] |
Premium 10¢ [background-color: #feffe8] |
SOYBEAN MEAL FUTURES
| CENTRAL (PAR) | NORTHEAST | MID SOUTH | MISSOURI | EAST IOWA | NORTHERN | |
| Ratio: | 0.994 | 0.037 | 0.000 | 3.200 | 1.284 | 0.015 |
| Par Change: | No Change | No Change | No Change | No Change | No Change | No Change |
| Non-Par Change: |
Premium $1 [background-color: #e7f2e5] |
Premium $1 [background-color: #e7f2e5] |
Discount $1 [background-color: #ffe2e4] |
Premium $1 [background-color: #e7f2e5] |
||
| Conclusion: |
No Change [background-color: #feffe8] |
Premium $1 [background-color: #feffe8] |
Premium $1 [background-color: #feffe8] |
Discount $1 [background-color: #feffe8] |
No Change [background-color: #feffe8] |
Premium $ [background-color: #feffe8] |
Example 2:
SOYBEAN OIL FUTURES
| EASTERN | EASTERN IOWA | ILLINOIS (PAR) | NORTHERN | SOUTHWEST | WESTERN | |
| Ratio: | 0.903 | 8.370 | 0.029 | 1.831 | 2.488 | 0.000 |
| Par Change: |
Discount 10¢ [background-color: #ffe2e4] |
Discount 10¢ [background-color: #ffe2e4] |
No Change |
Discount 10¢ [background-color: #ffe2e4] |
Discount 10¢ [background-color: #ffe2e4] |
Discount 10¢ [background-color: #ffe2e4] |
| Non-Par Change: |
Discount 10¢ [background-color: #ffe2e4] |
Discount 10¢ [background-color: #ffe2e4] |
Premium 10¢ [background-color: #e7f2e5] |
|||
| Conclusion: |
Discount 10¢ [background-color: #feffe8] |
Discount 20¢ [background-color: #feffe8] |
No Change [background-color: #feffe8] |
Discount 10¢ [background-color: #feffe8] |
Discount 20¢ [background-color: #feffe8] |
No Change [background-color: #feffe8] |
SOYBEAN MEAL FUTURES
| CENTRAL (PAR) | NORTHEAST | MID SOUTH | MISSOURI | EAST IOWA | NORTHERN | |
| Ratio: | 5.428 | 0.100 | 0.942 | 3.404 | 8.143 | 1.398 |
| Par Change: | No Change |
Premium $1 [background-color: #e7f2e5] |
Premium $1 [background-color: #e7f2e5] |
Premium $1 [background-color: #e7f2e5] |
Premium $1 [background-color: #e7f2e5] |
Premium $1 [background-color: #e7f2e5] |
| Non-Par Change: |
Premium $1 [background-color: #e7f2e5] |
Discount $1 [background-color: #ffe2e4] |
Discount $1 [background-color: #ffe2e4] |
|||
| Conclusion: |
No Change [background-color: #feffe8] |
Premium $2 [background-color: #feffe8] |
Premium $1 [background-color: #feffe8] |
No Change [background-color: #feffe8] |
No Change [background-color: #feffe8] |
Premium $1 [background-color: #feffe8] |