Hedging Event Risk with Weekly Treasury Options
Weekly options on Treasury futures provide one of the most effective and elegant methods to manage exposures to material economic, political, and other event risks.
Short-dated interest rate volatility has experienced significant swings over recent weeks, as markets digested a range of economic, political, and COVID-19 updates. Going into an election season and end of year activity, interest rate risk management will remain important.
Weekly options on Treasury futures can help in several ways. While many have noted that yields are low, looking at 10-year yields over the past six months shows dynamic leaps and bounds that one can better manage with the use of Weekly options on Treasury futures.
The basics of Weekly Treasury options
Weekly options come in two expiration flavors, resulting in two expirations a week: Wednesday Weeklies and Friday Weeklies. The former is frequently used to hedge and manage risk for events such as FOMC meetings and US elections (which often occur on Tuesdays or Wednesdays). The latter are commonly used for non-farm payroll days.
In the end, both Weekly and Wednesday options trade across all types of events, given the types of short-end exposures that require management. The unique ability to discreetly manage risk at so many strikes and expiries make these options ideal for heading swaption books. Weekly and Wednesday options can be much easier for hedging nuanced exposures to swaption positions as they move towards expiry. They are liquid and easy to execute, compared to OTC products of short expiry.
Weekly options are available on all Treasury futures, except for recently relaunched 3-Year Note futures. These weekly options are a rich source of risk management and positioning opportunities to lock in precision hedges and risk management. Exhibit 2 outlines the nuances and key differences of Wednesday and Friday options on Treasury futures.
Exhibit 1: Weekly options products and vendor codes
| PRODUCT | WEDNESDAY WEEKLY | FRIDAY WEEKLY | |||||
| CME Globex/Open Outcry | Bloomberg | Thomson Reuters | CME Globex | Open Outcry | Bloomberg | Thomson Reuters | |
| 2-Year | WT1-5 | TUIA Comdty | WTW | ZT1-5 | TW1-5 | 1W-5W | 0#TUW+ |
| 5-Year | WF1-5 | FVWA Comdty | WFW | ZF1-5 | FV1-5 | 1I-5I | 0#FVW+ |
| 10-Year | WY1-5 | TYYA Comdty | WYW | ZN1-5 | TY1-5 | 1M-5M | 0#TYW+ |
| Ultra 10-Year | WX1-5 | UXTA Comdty | WXW | TN1-5 | TN1-5 | UXW | 0#TNW+ |
| T-Bond | WB1-5 | USYA Comdty | WBW | ZB1-5 | US1-5 | 1C-5C | USW+ |
| Ultra T-Bond | WU1-5 | WNYA Comdty | WUW | UB1-5 | UL1-5 | 1J-5J | 0#AULW+ |
Exhibit 2: Key Weekly option differences
Wednesday Weeklies
- Growing liquidity with 32K contracts traded daily in 2019 – the second full year of trading
- Wednesday expirations coincide with FOMC meetings
- Expire on Wednesdays at 2:00 p.m. Central Time
- No contrary instructions will be allowed at expiration
- Two Wednesday expirations listed at any time
- Exercise into the next quarterly futures expiry
- Same strike price intervals and minimum tick sizes as Friday Weeklies
Friday Weeklies
- Deep liquidity with a record 205K contracts traded daily in 2019, +25% YoY
- Expire every Friday that is not already a quarterly or serial Treasury option expiration
- New weekly option listed the business day following an expiration
- Exercise into the next quarterly futures expiry
- Contrary instructions are allowed at expiration
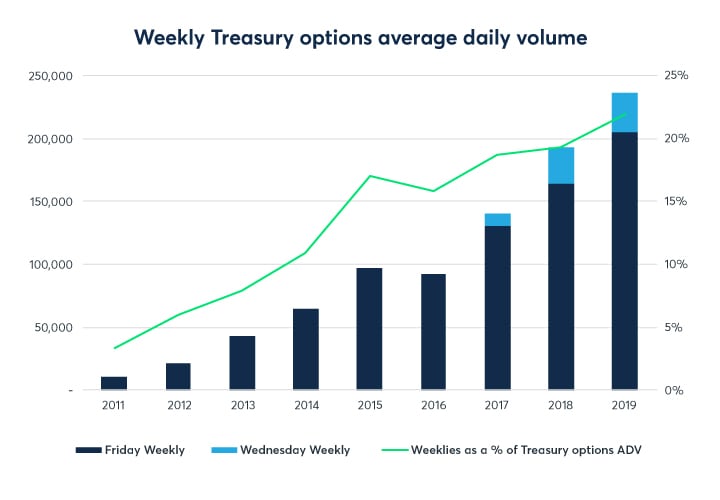
Over the past decade, trading volumes in Weekly Treasury options have surged, particularly around key economic events. In 2019, average daily volume (ADV) in Weekly Treasury options hit a record 237K contracts, accounting for a 22% of all Treasury options volume (exhibit 3).
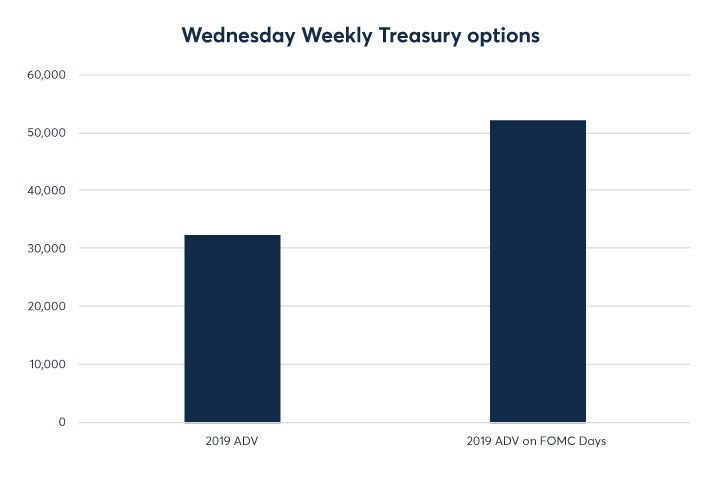
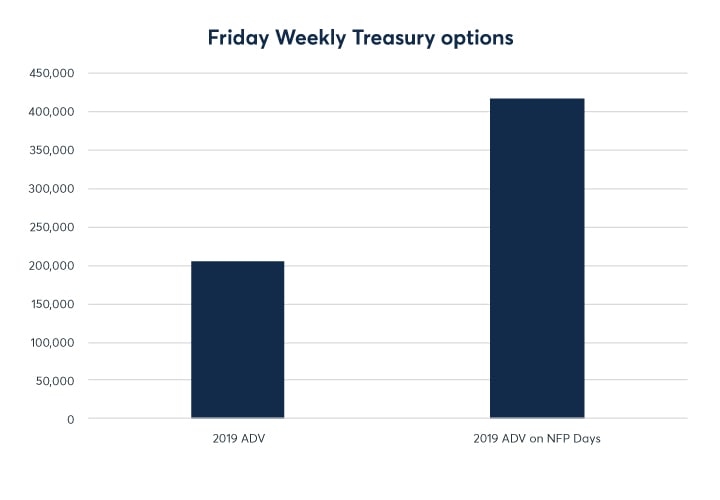
Wednesday weekly options, launched in 2017, saw ADV jump to 52K contracts per day on FOMC days in 2019, +61% vs. their 2019 annual ADV of 32K contracts per day (exhibit 4). Likewise, Friday Weekly options saw ADV explode to 418K contracts per day on Nonfarm Payroll report days in 2019, more than double their 2019 annual ADV of 204K (exhibit 5).
Exhibit 3: Long-term Weekly option volume growth
Source: CME Group
Exhibit 4: Wednesday Weekly Treasury options ADV – 2019 FY vs. 2019 FOMC days
Source: CME Group
Exhibit 5: Friday Weekly Treasury options ADV – 2019 FY vs. 2019 Nonfarm Payroll days
Source: CME Group
Where are we now
For people that manage interest rate risk, events over the last few months have been a whirlwind:
- The Federal Reserve Open Market Committee supported markets by moving the Effective Federal Funds Rate from around 2.50% to just above 0.0%.
- The US Government is projected to have a record federal budget deficit of $3.7 trillion for the 2020 fiscal year. Additional details can be found in the article, US Treasury Issuance: Drivers, Mechanics, and Holders. Treasury auctions will be another potential source of short-term market movement.
- The 20-year bond is changing the shape of the yield curve and the desire of the US Treasury to extend the duration of the debt profile has made the long-end of Treasury futures very active.
- The FOMC released a statement in late August 2020 saying that it "seeks to achieve inflation that averages 2 percent over time."
- The pandemic continues to impact markets as cases rise.
- The US Election is less than a week away, and political outcomes and timing remain uncertain.
- A second stimulus package is as of this writing being discussed by Congress and the Trump administration, but the size and specifics remain unclear and impact markets daily.
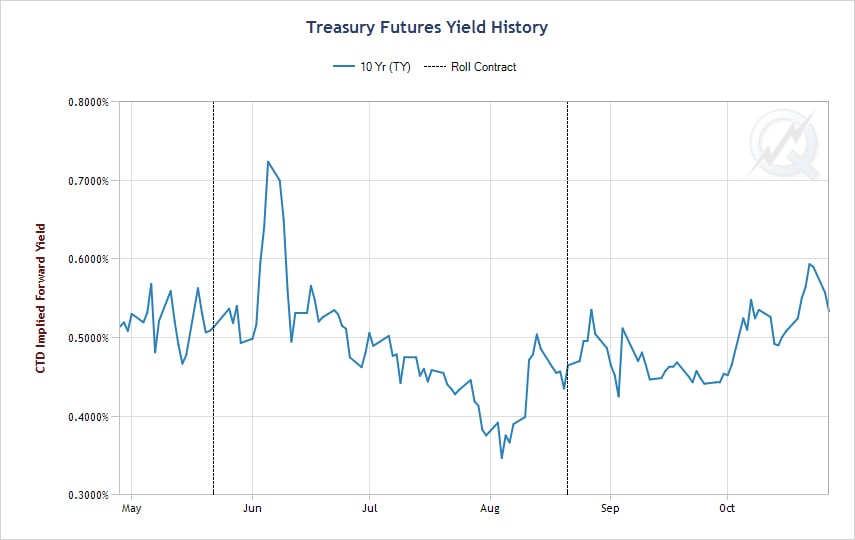
All these events are like holding a beach ball under the water. It could jump above the water at unexpected times. During the past six months, interest rates have been trading around their lows and have exhibited very significant swings. Weekly options on Treasury futures can help manage risk related to these opportunities.
Exhibit 6: 10-Year Treasury Futures CTD Implied Forward Yield History (28 April 2020 – 28 October 2020)
Source: QuikStrike Treasury Analytics tool
Watching volatility
Market participants know that volatility is one of the key drivers to watch when pricing and transacting options. QuikStrike provides a detailed volatility analysis, showing an in-depth view of volatility movements. Exhibits 7 and 8 show that there can often be material differences between monthly and weekly volatility movements.
Exhibit 7: 10-Year Treasury ATM volatility for select constant maturities (28 April 2020 – 28 October 2020)
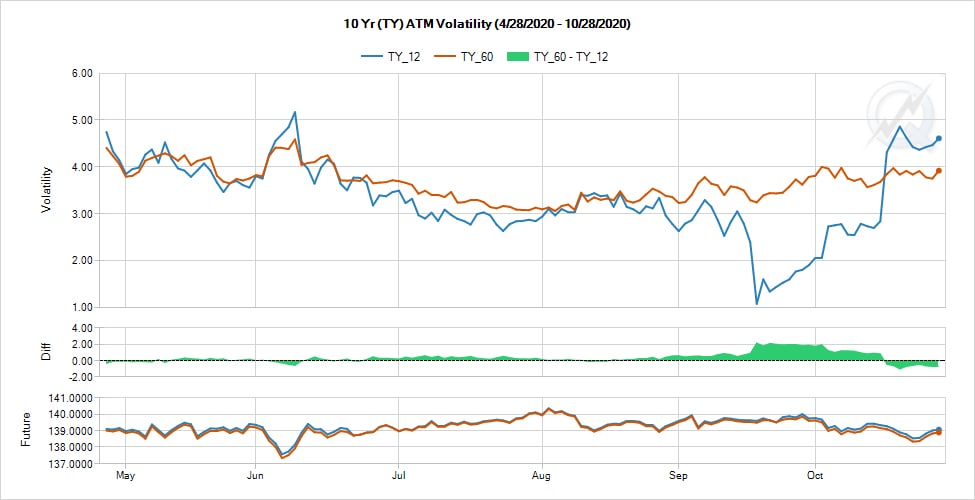
Source: QuikStrike
Exhibit 8: 30-Year Treasury ATM volatility for select constant maturities (28 April 2020 – 28 October 2020)
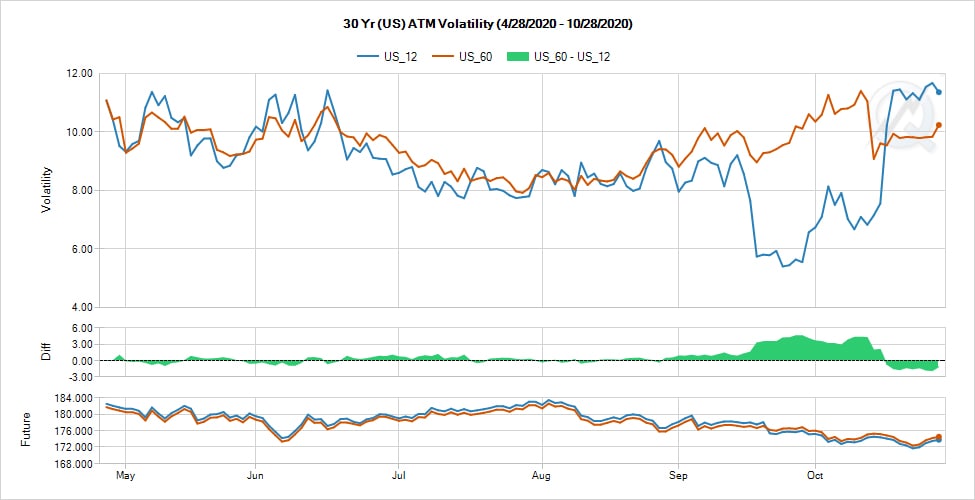
Source: QuikStrike
Volatility term structure is a critical element to observe with Weekly options. The below term structure (exhibit 9), using a combination of Weekly, Wednesday Weekly, and Quarterly/Serial options on Treasury futures, shows how interesting and active the front end of the volatility curve can be.
Exhibit 9: 10-Year Treasury Volatility Term Structure (28 October 2020)
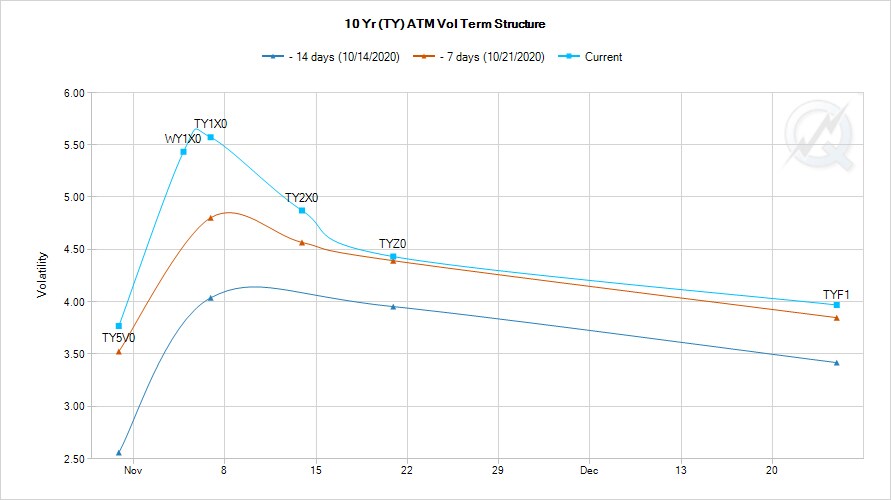
Source: QuikStrike
Use cases
There is a plethora of option strategies that Weekly options fit well. Let’s consider three hypothetical cases where two investors are considering what to do with the market. For example one, an asset manager has a portfolio of long fixed income securities and feels over the next week (given economic releases and political events) the market could go up slightly or down quite significantly. His friend, who he is talking to about the market, works as a portfolio manager at a hedge fund. Right now, she does not have a position but has the same market view. Year to date, their investment strategies have been successful, and they want to structure their portfolios with upside exposure to the market without exposure to significant downside moves in the market.
Covered call
The asset manager initially assesses how he can structure the portfolio to capture more market upside. He looks at the price of weekly calls and sees that out-of-the-money (OTM) calls to the upside are well priced. He realizes that he can position the portfolio to capture additional upside economics by selling some slightly out-of-the-money calls. He knows this will cap the portfolio’s upside economics, but he likes how this trade is simple to execute while potentially increasing his profit up to that strike level.
In this example, let us assume that the current price for hypothetical Treasury futures is $138 and a weekly OTM call on this future struck at $140 can be sold for 1.5 points. The payoff of the portfolios for the next week is shown in Exhibit 9.
Exhibit 10: Covered call payoff
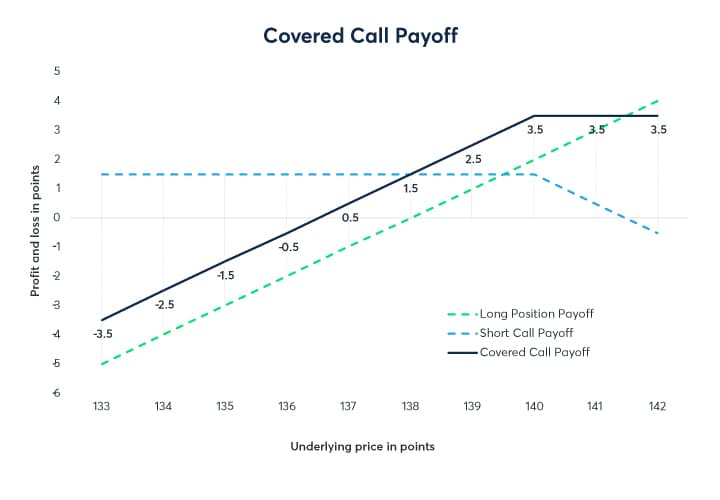
The dotted green line is the payoff profile for the bond portfolio above and below 138 in points. For each point the market increases or decreases, the P&L (in points of the long position) moves by a similar amount. The dotted blue line is the payoff profile for the short 140-strike weekly call sold for 1.5 points. The first observation is that the sale of the OTM weekly call increased the profit line of the portfolio above the existing profit line of the long only positions. That provides not only a boost to the profit, but a small amount of additional amount of income (1.5 points) if the market sells off. However, the upside for the next week is capped at a total gain of 3.5 points. Any profit above the 140-strike that the existing portfolio makes would then be paid to the long holder of the 140-strike weekly call.
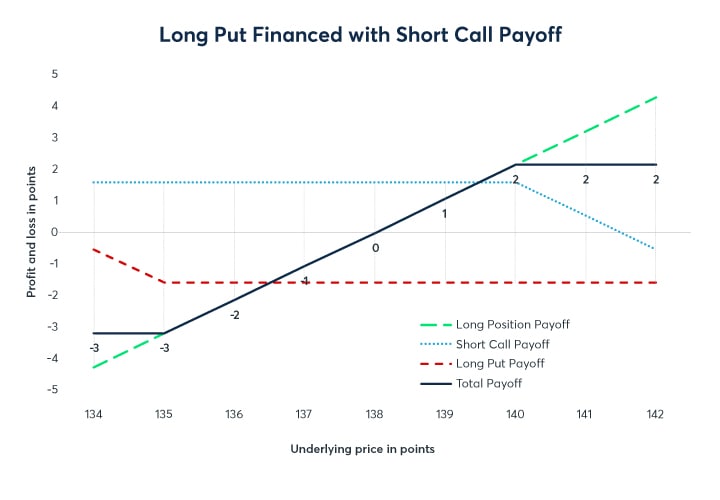
Long put financed with short call
While the covered call helps with additional income, it still leaves the asset manager’s portfolio exposed to a more significant move to the downside. To manage that risk, he could purchase a long call position. As he seeks to sell the 140-strike weekly call, he can use the process of that call sale to finance the purchase of a put. In this hypothetical example, the asset manager sees he can purchase a similarly priced put for 1.5 points struck at 135. Here is how that payoff profile appears with the addition of this put purchase.
Exhibit 11: Long put short call payoff
This payoff graphic is like the covered call with a few important changes. First, the dotted red line is the payout for a put over a range of the market. Notice at the 135-strike, the dotted red line begins to create a positive P&L profile that limits the losses to the portfolio should the market sell off to the 135 level. The total payoff P&L is represented by the solid black line. Over the next week, the P&L profile for the overall position is the same and is capped to two points higher, but also has limited losses to no more than three points. The asset manager is pleased with this position, as he believes that the range of outcomes over the next week is reasonable and this positions the portfolio well for the events for which he is concerned.
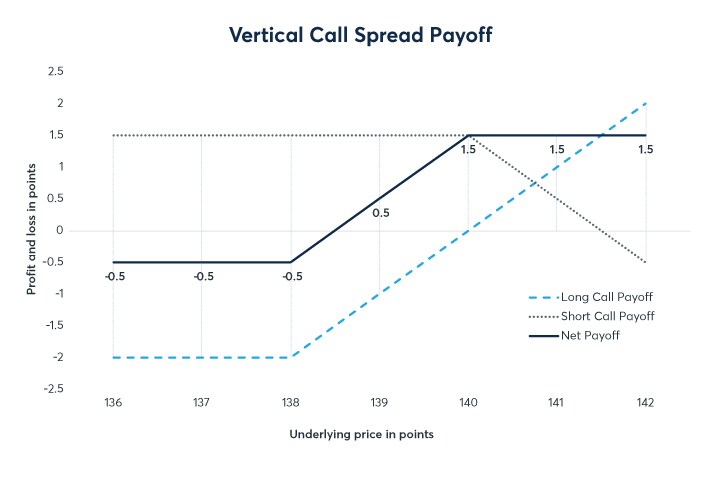
Vertical call spread
The hedge fund portfolio manager also believes that the market could go up but wanted any potential portfolio construction to limit downside risk. In this hypothetical example, she found that buying an at-the-money (ATM) 138-strike Weekly call option for two points on this and simultaneously selling the 140-strike Weekly call option for 1.5 points on this hypothetical Treasury future achieved the exposure she seeks. Exhibit 11 show the payoff.
Exhibit 12: Vertical call spread payoff
The darker blue dotted line is the payoff from the long 138-strike call, while the lighter blue dotted line is the payoff from the short call. The dark line is the overall position. Over the next week, the portfolio is positioned to potentially make P&L while limiting the downside exposure.
Weekly options on Treasury futures – Ease of use
Transacting Weekly options on Treasury futures is simple when compared to the over the counter (OTC) swaption market. It is not required to establish ISDA Master Agreements and collateral support indexes (CSAs), which are expensive and time-consuming. Plus, they are often necessary for each unique fund. Weekly options on Treasury futures do not need such an elaborate set-up.
Weekly options on Treasury futures form a rich volatility surface that can be useful for a variety of investors. The earlier examples highlight opportunities for asset managers and hedge fund portfolio managers. Investors, such as mortgage investors and others that deal with the swaptions market, can find good value in the extensive offering of Weekly options on Treasury futures. These options are particularly helpful to manage the dynamics of gamma (change in DV01) and theta (change in P&L over time) exposures at the one-month and shorter time periods that can be significant if not managed correctly.
Summary
Weekly options on Treasury futures offer plenty of interesting structures and risk management tools. They allow market participants to zero in the key risks posed during a certain period of time. They are easy to use with readily available analysis for diving into the dynamics of the front-end of the volatility surface. They can provide more flexibility to manage existing positions and greater precision to trade high impact economic events.