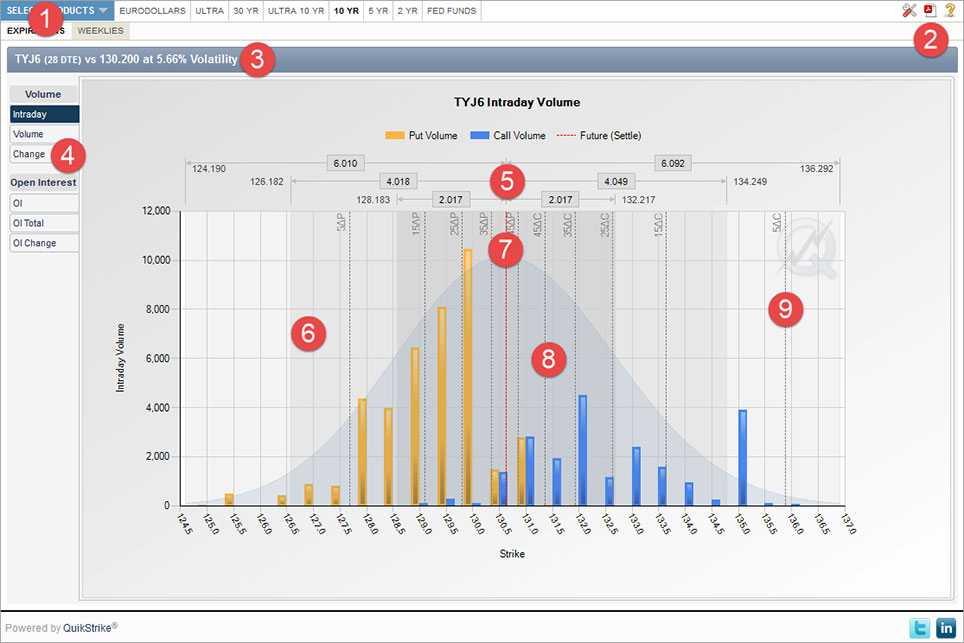
Based on an expiration’s most recent settlement information, this report displays various volume and open interest values (by strike) plotted on top of the current distribution for the most recent settlement volatility and days to expiration. The 1, 2 and 3 standard deviations are also displayed as numeric ranges on top of the chart as well as shaded areas on the chart background. Theoretical Delta markers appear as dashed vertical lines for reference as well. The red dashed line represents the settlement price for the option’s corresponding underlying future.

Clicking on the current product group or the arrow next to the current product group will display a dropdown with all the product groups that are currently available in QuikStrike. After selecting a group, all products for that group will be displayed in the horizontal menu next to the blue product group selector. If a product contains CSOs (calendar spread options), APOs (average price options) and/or product spreads (like WTI/Brent), those products will be listed separately under the CSOs or Exotics section of each menu column.
Expirations for each product are displayed directly underneath the product group and product selection menu. Click on any of the expiration menu groups to see the list associated with that group name. Clicking on an individual expiration will display the information accordingly.
Tooltip: Select product group and display product list with corresponding expirations for current product
Clicking the PDF icon will show two options for printing the current page information - Portrait or Landscape. The recommended print format for this report (greatest resolution, etc.) is Landscape.
The help (question mark) button will show markers on key areas of the report with a short title or description of function or data displayed.
Tooltip: Create PDF of report (best result: Landscape)
The information in the title bar is crucial to the report itself. The DTE (days to expiration) and volatility are used to determine the distribution and standard deviation values. The price is displayed as the red dashed line on the chart and will help as a marker to determine which strike is ATM (at-the-money).
Tooltip: Expiration information as of most recent (final) settlement
Click on any of the available tabs to display the volume and open interest data. All values, with the exception of Intraday – which are the electronic volume numbers for the current trading day, are as of the most recent (final) settlement.
Tooltip: Choose data element to display as the primary plot value
Numerically displayed ranges for each standard deviation. Values represent the distance from the current settlement price – or red dashed line.
Tooltip: 1, 2 & 3 standard deviation ranges based on most recent volatility and DTE
Each shaded area on the chart represents the corresponding standard deviation range with shading from darker (1 SD) to lighter (2 SD) to lightest (3 SD).
Tooltip: Areas are shaded according to standard deviation ranges
The red dashed line is the most recent future settlement price for the option’s corresponding future.
Tooltip: Most recent underlying settlement price
This is the distribution chart given the current volatility and DTE values.
Tooltip: Distribution based on most recent settlement volatility
The odd value Delta lines are plotted as a guide for determining how far a strike is out of the money.
Tooltip: Theoretical Delta lines