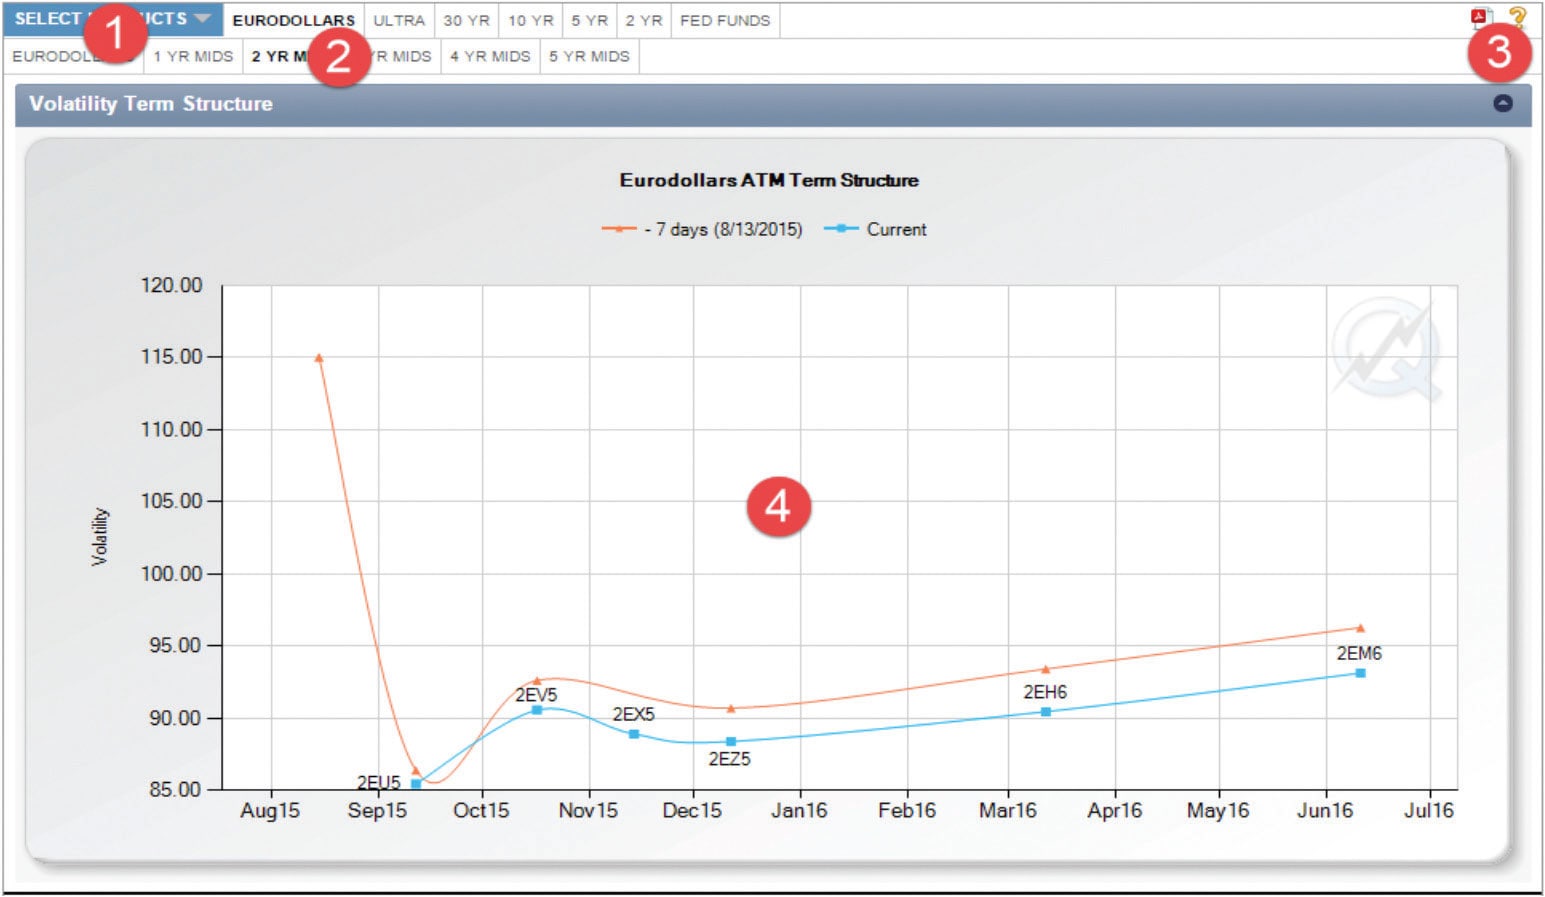
The Volatility Term Structure tool provides an overview of at-the-money (ATM) volatilities for option contracts with 1-year or less until expiration. The blue line (settlements) and the orange line (settlements from 1-week prior) provide a simple yet powerful way of viewing and comparing market volatility over this period of time. For products like Eurodollars or many of the active Agricultural markets, there are multiple groups available for display (i.e. regular contracts and mid-curve or short-dated options).

Clicking on Select Products or the arrow next to Select Products will display a dropdown with all the product groups that are currently available in QuikStrike. After selecting a group, all products for that group will be displayed in the horizontal menu next to the blue product group selector.
Tooltip: Select product group and display product list
Clicking the PDF icon will show two options for printing the current page information - Portrait or Landscape. The recommended print format for this report (greatest resolution, etc.) is Landscape.
The help (question mark) button will show markers on key areas of the report with a short title or description of function or data displayed.
Tooltip: Create PDF of report (best result: Landscape)
For products with multiple option groupings (i.e. Eurodollar mid-curves or Agricultural short-dated options), a secondary menu will be displayed below the product list. Choose from this list to view a year’s worth of expirations and the corresponding volatility term structure.
Tooltip: Select which expiration groups to display in the chart
Displays the most recent settlement ATM volatility term structure versus 1 week prior. If an expiration expired during that 1 week time-frame, the current chart will have one less data point for comparison. Click on any data point to view more detailed information.
Tooltip: Vol term structure chart showing current volatility vs 1 week ago