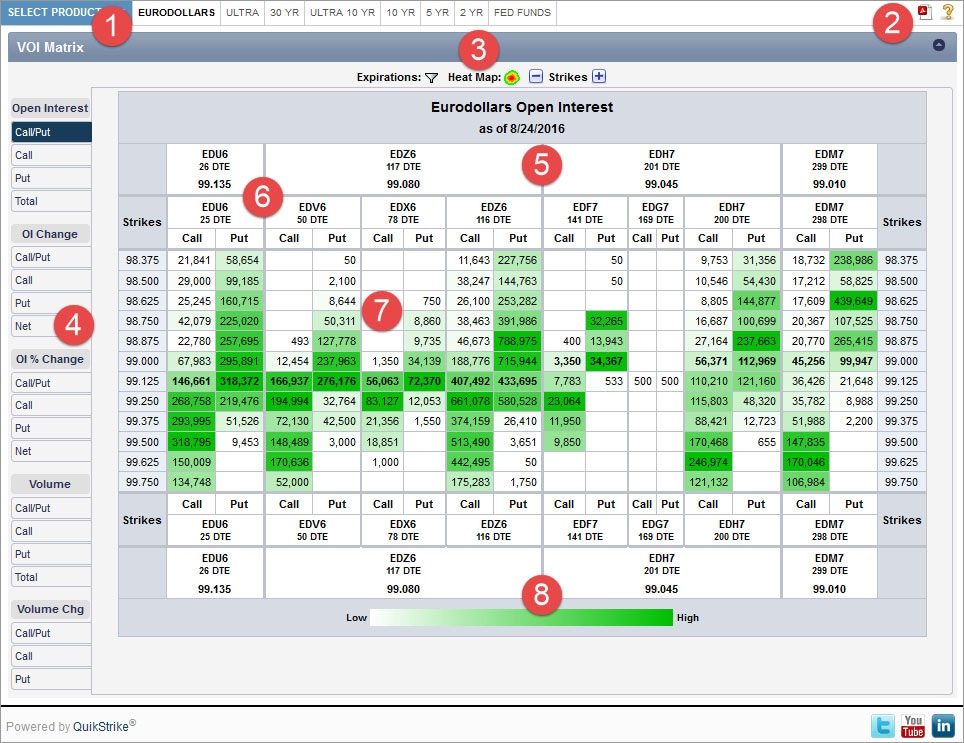
This tool provides current Open Interest and Volume numbers (heat) mapped in order to quickly discern where the higher and lower magnitude numbers are located within each of the matrices. For values where all numbers are positive, the mapping will show white (low) to green (high). For values where numbers can be positive or negative (i.e. changes), the mapping will range from red (low) to white (middle of the road) to green (high). The control can be heated on a per column (default) or matrix level – see Analysis Controls explanation below for a comprehensive overview of how to manipulate what is displayed.

Clicking on the current product group or the arrow next to the current product group will display a dropdown with all the product groups that are currently available in QuikStrike. After selecting a group, all products for that group will be displayed in the horizontal menu next to the blue product group selector. If a product contains CSOs (calendar spread options), APOs (average price options) and/or product spreads (like WTI/Brent), those products will be listed separately under the CSOs or Exotics section of each menu column.
Tooltip: Select product group and display product list
Clicking the PDF icon will show two options for printing the current page information - Portrait or Landscape. The recommended print format for this report (greatest resolution, etc.) is Landscape.
The help (question mark) button will show markers on key areas of the report with a short title or description of function or data displayed.
Tooltip: Create PDF of report (best result: Landscape)
Use the different controls on this section of the view to change the display characteristics of the Heat Map Report. See below for a detailed explanation of each.
Tooltip: Various data settings to control how the heat map is displayed
The report will initially display the first expiration group (or a minimum of 6 expirations from both the first and second group). Click this button to display entire set of expirations available and select groups or an individual expiration as necessary.
Tooltip: Add or remove expirations
Use this control to compare values to prior day (default), one week or one month ago. Table header will display the actual date range of the comparison. NOTE: If a day in the past lands on an exchange holiday, the closest trading day will be selected.
Tooltip: Compare to prior day, week or month values
This control will allow you to change the per column heating (default) to the entire matrix. You can also turn off the heated display by unchecking the Heat Map check box.
Tooltip: Change heat map settings
Clicking the “-“or “+” buttons will remove or increase the number of strikes displayed on both the top and bottom of the ranges. “-“ will remove 5 strikes from both sides and “+” will add 5 strikes to both (until there are no more strikes to add in either direction). The default is set to display 15 strikes above and below the (highest and lowest) ATM strikes from within the set of currently selected expirations.
Tooltip: Change the number of strikes displayed
Choose from Open Interest (OI), OI Change, Volume and Volume Change reports. First tab in each group will display both calls and puts in a side by side format. Call, Put and Total tabs will simplify table and display only those values.
Tooltip: Selected tab determines which value to display in the matrix
Expirations are grouped in expiration order by underlying future associated with that expiration. If more than one option expiration is tied to a given underlying future, then all expirations will be listed under that underlying (given it is selected in the Expirations filter). Future headers display the symbol, current DTE (days to expiration) and underlying price for that future.
Tooltip: Expirations are grouped by their underlying future
Expiration headers display the option symbol and DTE for each expiration. Call and Put columns will both be shown by default. When a Call, Put or Total tab is selected, these column headers will be removed altogether (since the tab selection will drive the value displayed in each cell).
Tooltip: Expiration for which the matrix option values apply to
Lists OI, Volume or changes for the same (in accordance with date selection from the Compare control). The control will default to total Open Interest for most recently (closed) trading day and display both the calls and the puts with the heat map set to column level coloring. NOTE: ATM strikes, for both previous settle and current, will have a bolded font.
Tooltip: Shows corresponding option values based on selected tab
This legend shows the range of colors being used for the current heat map. It shows a range of white (low) to green (high) when values are all positive and a range from red (low) to white (middle of the road) to green (high) when values can be positive or negative.
Tooltip: Heat map color range for current value set