CFTC Commitment of Traders Report User Guide
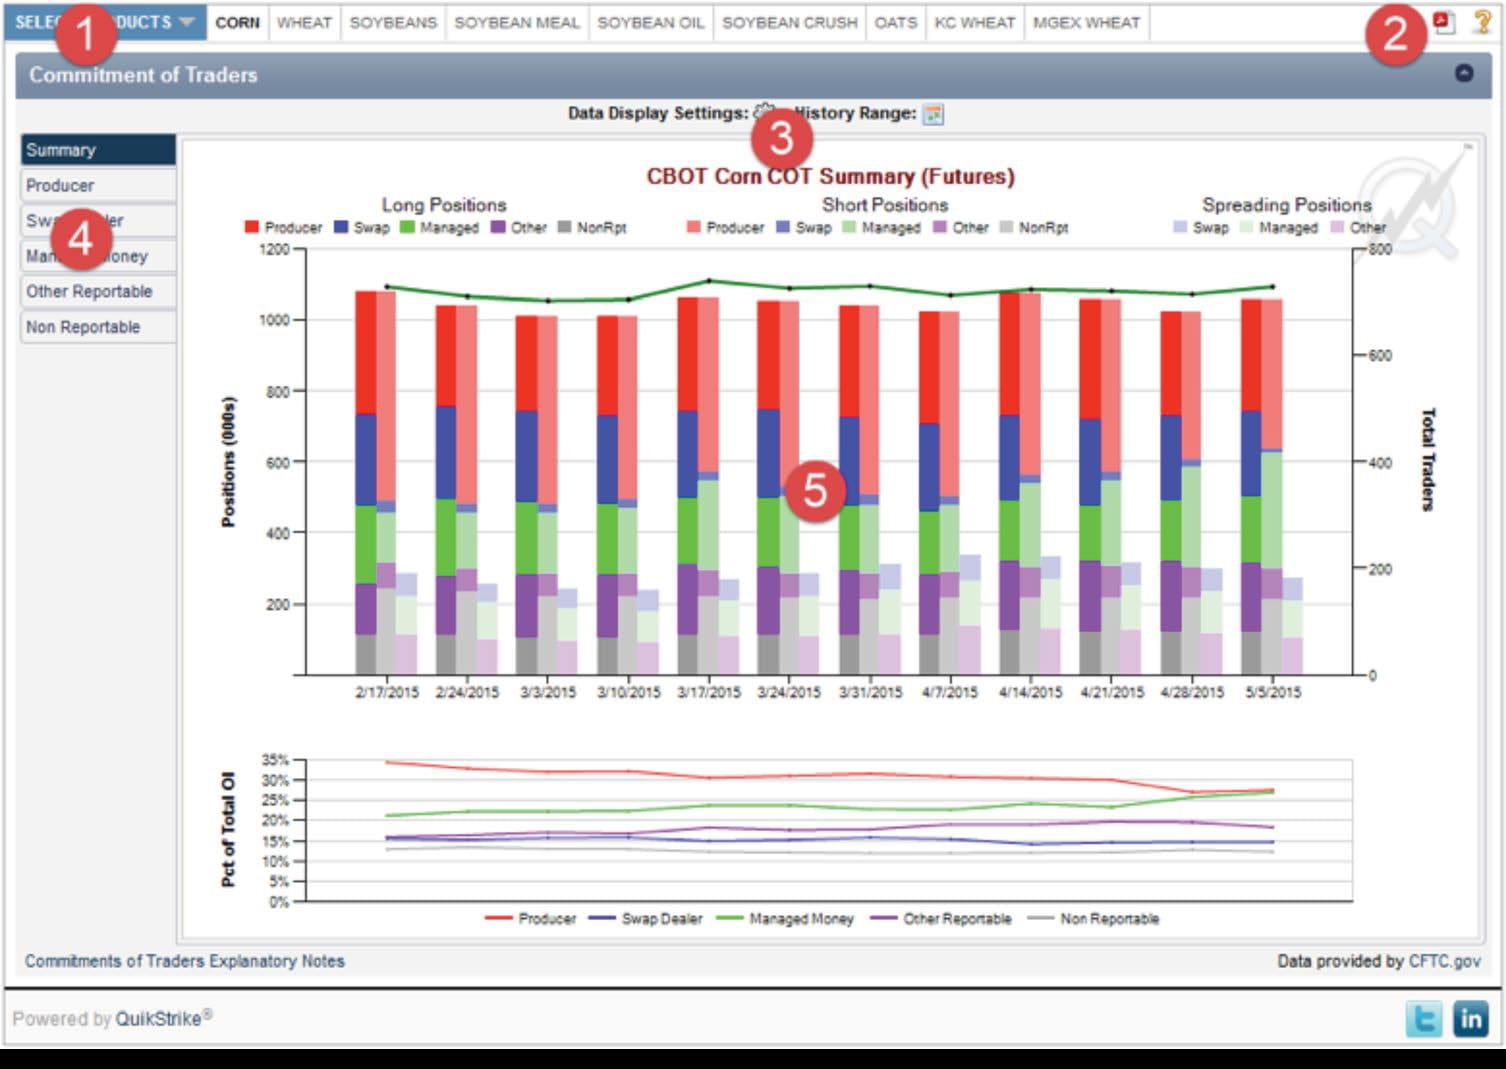
Back to ToolThe Commitments of Traders (COT) tool provides a comprehensive and highly configurable graphical representation of the CFTC’s report on market open interest released each Friday afternoon based on positions held during the prior Tuesday. Markets are only included if 20 or more traders hold positions equal to or above the reporting levels established by the CFTC and the respective exchanges.
Information is presented by client segment, categorized as follows:
- Physical Commodities: Producer, Swap Dealer, Managed Money and Other Reportable
- Financial Products: Dealer, Asset Manager, Leveraged and Other Reportable.
- Unlike most COT reports, this tool also breaks out the non-reportable information, which includes all traders that fall below the reporting threshold.
- NOTE: Report data is generally ONLY available for major product categories.


Clicking on the current product group or the arrow next to the current product group will display a dropdown with all the product groups that are currently available in QuikStrike. After selecting a group, all products for that group will be displayed in the horizontal menu next to the blue product group selector.
Tooltip: Select product group and display product list
Clicking the PDF icon will show two options for printing the current page information - Portrait or Landscape. The recommended print format for this report (greatest resolution, etc.) is Landscape.
The help (question mark) button will show markers on key areas of the report with a short title or description of function or data displayed.
Tooltip: Create PDF of report (best result: Landscape)
Use this menu to change the display characteristics of the COT Report.
Summary Chart Settings
Control whether Futures, Combined Futures and Options or only Options data is displayed. Change chart type from Bar to Line as well as limit the categories shown on the summary chart.
Detail or Category Chart Settings
Here you can also change what the main plot value displayed in the chart will be. You can choose from the following: Positions, Change in Positions, Percent of Open Interest and Number of Traders. These groups are also displayed in the table below the chart showing current, last quarter and last year’s values.
History Range The chart data displayed defaults to a 3-month historical view. However, 6M, 9M, 1Y, 2Y, 3Y, 5Y and ALL (from June 2006) selectable as date range options as well.
Tooltip: Change the type and amount of COT history data to display
Displays the greatest change in open interest across the entire product.
Tooltip: Choose to view summary data or a specific category
Utilize the Prev and Next links to move backward and forward in time. Up to 30 days of history will be available at any given time.
When the Data Display Settings -> Chart Value has Open Interest Change selected (the default setting is Open Interest) the Trade Date title will change to Compare Date and the tool will then show the change in open interest between the most recent trading day and the date selected. Note that the initial comparison when changing to this display mode will be between the last trading day and the most recent prior trading day.
Tooltip (Summary): Charts commitments of traders information across all categories
Tooltip (Category): Charts commitments of traders information for the selected category
Positions, Change in Positions, Percent of Open Interest and Number of Traders are displayed in this table showing current, last quarter and last year’s values.
Tooltip: Other relevant COT information for the current date as well as 3 months and 1 year prior.