User Help System
Cash Futures and FX Link Analysis
As before, the top toolbar allows you to configure the dashboard to display the information you are interested in.

Currency
The dashboard features the same 18 currency pairs as the Cash Futures Analysis. FX Link data is available for 8 currency pairs: EUR/USD, USD/JPY, AUD/USD, USD/CAD, GBP/USD, USD/CHF, NZD/USD, and USD/MXN. Where one of the additional ten currency pairs is chosen, outright futures market data is shown only.
Date Range
You can choose to review over recent calendar months, the last 30 days, or you can enter your own custom date range. You can also choose the intra-day time period that is shown in the dashboard. Note that selecting a different date range via the drop down will update the start and end times.
By default the tool displays 00∶00 – 20∶00 GMT.
Order Book Level
In addition to TOB data, you can choose to view spread and order size data for up to ten levels of the orderbook for both Futures and FX Link markets.
Granularity
The tool enables traders to select the time granularity that they wish to see – from 60 mins down to 5 min intervals.
Volume Plot
The traded volume chart can be displayed in terms of the number of contracts traded, the US$ value or the percentage of volume observed in each time period.
Contract
This allows you to spread and volume data for either the most active contract month (typically the front quarterly contract in the major currency pairs) or all contract months blended together.
Types of Analysis
Percentage of traded contracts and volume and orderbook spread in full pips for each market segment

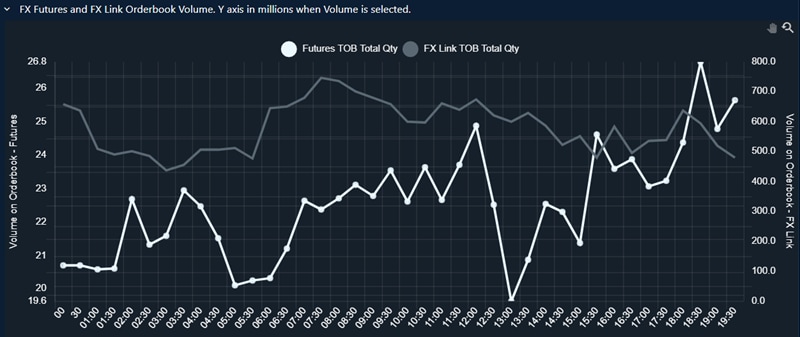
- Plots the traded volume for FX futures and FX Link markets.
- Traded volume is shown in terms of number of contracts traded, the US$ value traded, or as a percentage of the hours selected.
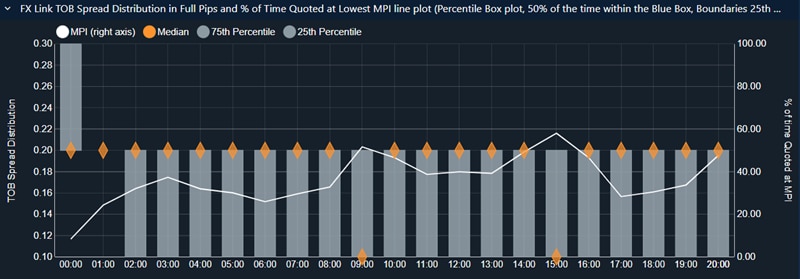
FX Link TOB Spread Distribution in Full Pips
A box-whiskers (percentile) plot that buckets TOB FX Link spreads into an hourly statistical plot. The median spread is shown in orange. The grey box highlights the range observed 50% of the time between the 25th and 75th percentiles.
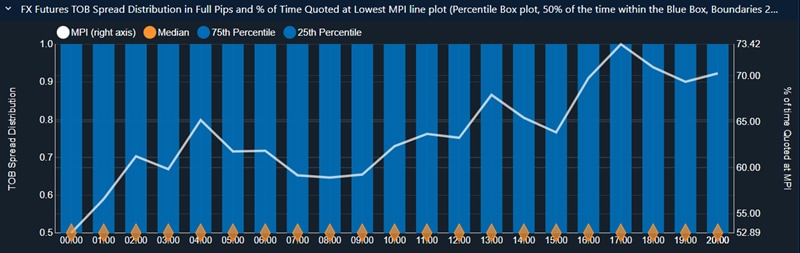
FX Futures TOB Spread Distribution in Full Pips
Similar display to FX Link TOB spread distribution but displaying TOB FX futures spreads. This is the same data as shown on the Cash Futures Analysis panel.
FX Futures and FX Link Orderbook Volume
A side-by-side comparison of available FX futures and FX Link orderbook volume for the selected orderbook levels.