User Help System
Historical Market Analysis
These charts offer a historical analysis of the EBS Spot FX, FX Futures, and FX Links markets, with enhanced detail provided through volume plots and contract information.
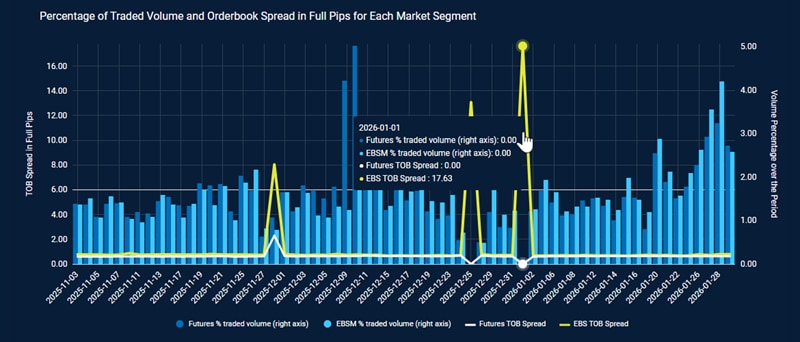
Percentage of Traded Volume and Orderbook Spread in Full Pips for Each Market Segment
This chart plots the traded volume for FX Futures and EBS Markets. Traded volume is shown in terms of number of contracts traded, or as a percentage of the hours selected.
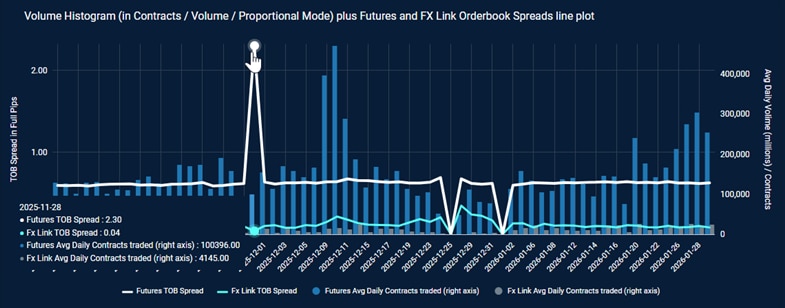
Volume Histogram plus Futures and FX Link Orderbook Spreads line plot
The Volume Histogram Plus Futures and FX Link Orderbook Spreads Line Plot chart displays the percentage of traded contracts and volume, along with the orderbook spread in full pips, for each market segment .Percentage of traded contracts and volume and order book spread in full pips for each market segment
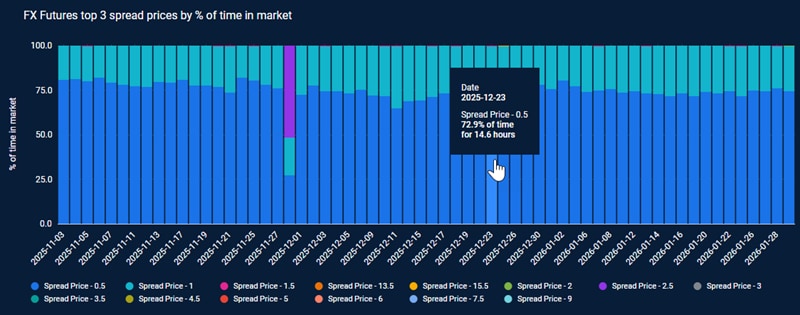
FX Futures top 3 spread prices by % of time in market
This chart displays the time-weighted distribution of spread levels for the FX Futures market. For example, it may show that the spread remained at 1.0 for 70% of the hour and 0.5 for the remaining 30%
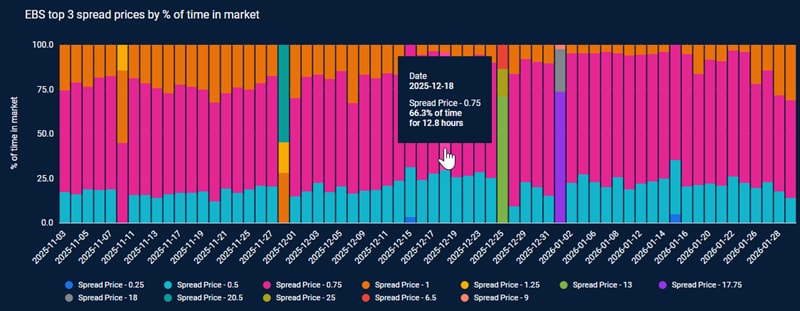
EBS top 3 spread prices by % of time in market
This chart displays the time-weighted distribution of spread levels for EBS Market. For example, it may show that the spread remained at 1.0 for 70% of the hour and 0.5 for the remaining 30%.
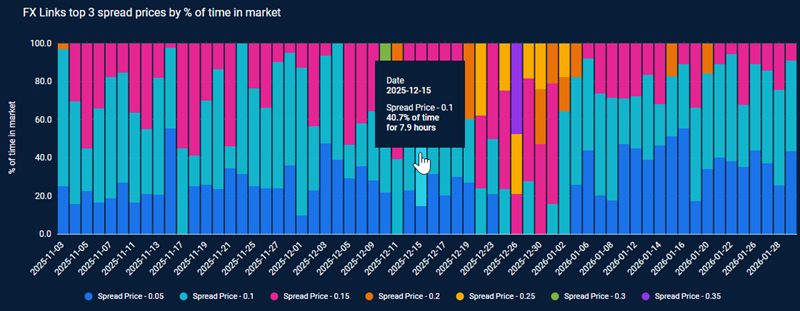
FX Links top 3 spread prices by % of time in market
This chart displays the time-weighted distribution of spread levels for FX Links. For example, it may show that the spread remained at 1.0 for 70% of the hour and 0.5 for the remaining 30%.
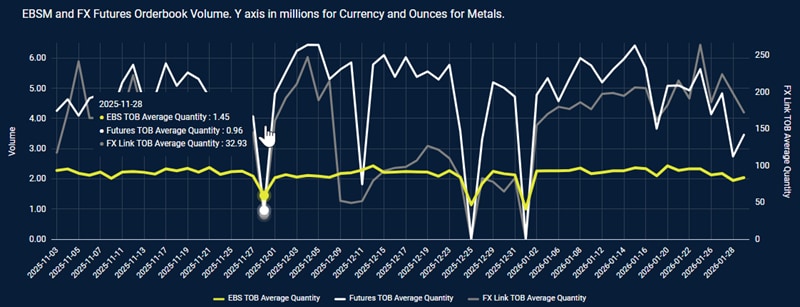
EBSM and FX Futures Orderbook Volume. Y axis in millions for Currency and Ounces for Metals
This chart displays a side-by-side comparison of available EBS Market and FX futures order book volume for the selected order book levels.