User Help System
FX Link vs Futures
Use this dashboard to compare and contrast FX Link vs FX Futures
- Plots the traded volume for FX Futures and FX Link markets.
- Traded volume is shown in terms of number of contracts traded or as a percentage of the hours selected.
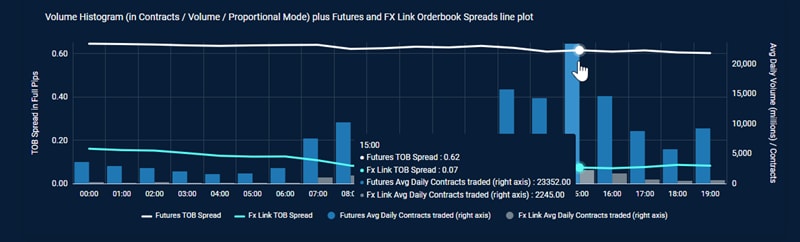
Volume Histogram plus Futures and FX Link Orderbook Spreads line plot
Percentage of traded contracts and volume and order book spread in full pips for each market segment
- Plots the traded volume for FX futures and FX Link markets.
- Traded volume is shown in terms of number of contracts traded or as a percentage of the hours selected.
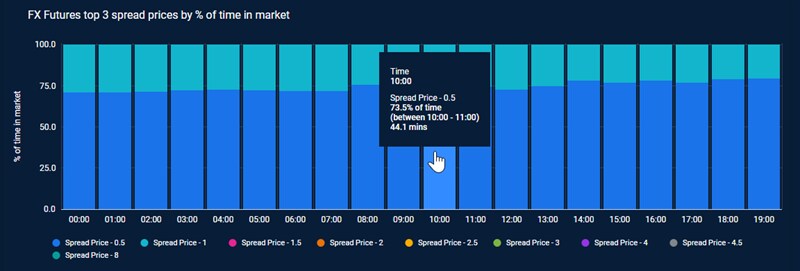
FX Futures top 3 spread prices by % of time in market
Displays the time-weighted distribution of spread levels for the FX Futures market. For example, it may show that the spread remained at 1.0 for 70% of the hour and 0.5 for the remaining 30%.
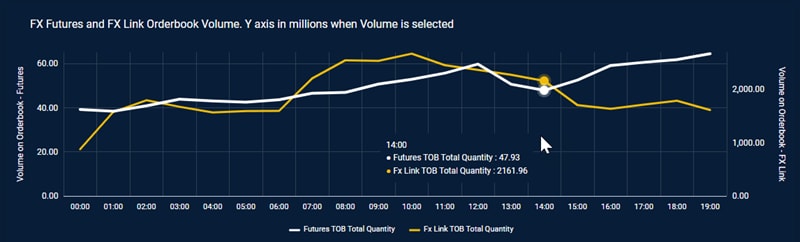
FX Futures and FX Link Orderbook Volume. Y axis in millions when Volume is selected
A side-by-side comparison of available FX Futures and FX Link order book volume for the selected order book levels.