Ultra 10-Year Note futures: A $100B Market
Introduced in 2016 to provide a futures contract more closely tied to the 10-year point on the Treasury curve, the Ultra 10-Year Note futures contract (CME Globex Symbol: TN; Bloomberg Symbol UXY) is one of the most successful launches in CME Group’s history. Today, it has grown into a $100 billion market in just five years. With a deliverable basket of original issue 10-Year US Treasury Notes with remaining terms to maturity at delivery between nine years and five months and 10 years, Ultra 10 offers an efficient, off-balance sheet and is a precise tool for hedging 10-year US Rates exposure.
Exhibit 1: Ultra 10-Year Note futures annual ADV and open interest
Source: CME Group
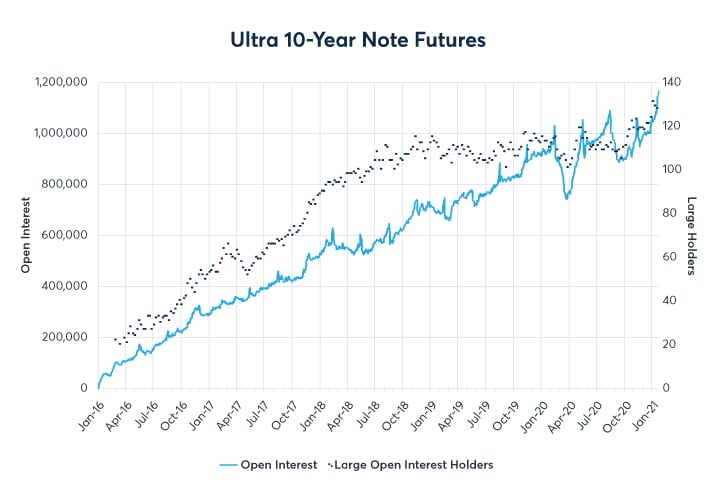
Recently, TN has broken out to even greater levels, aided in part by an increasingly broad pool of participants. In January, as TN tallied a record 131 large open interest holders in the CFTC Commitments of Traders report, open interest jumped 14% MoM to a record 1.14M contracts.
Exhibit 2: Ultra 10-Year Note futures daily open interest and weekly large open interest holders
Source: CME Group, CFTC Commitments of Traders Report
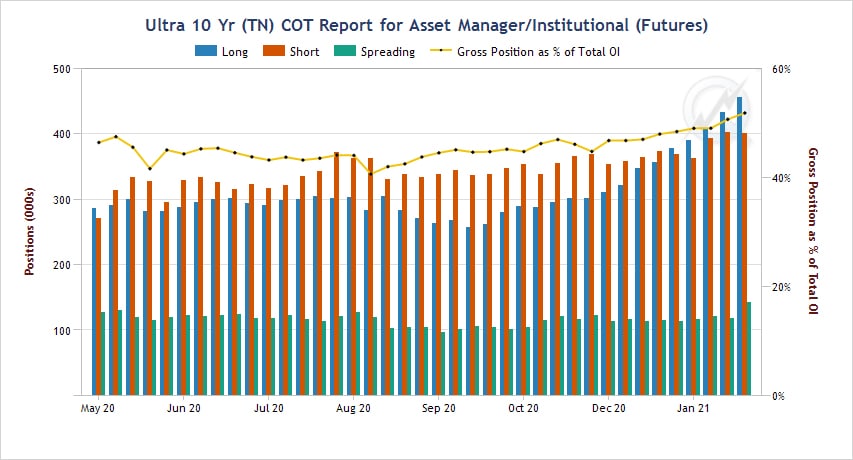
Additionally, January is often a time when asset managers establish positions based on their allocation needs. CFTC positioning data (Exhibit 3) shows Asset Manager gross position as a percentage of total TN open interest has risen to a nine-month high of 52%. The chart also shows Asset Manager long positions (blue bars) began exceeding short positions (red bars) on 12/31/20 for the first time since May 2020. The risk expression and capital efficiency of the Ultra 10-Year contract makes it a compelling instrument for managing exposure at the key 10-year tenor point on the UST curve.
Exhibit 3: Asset Manager/Institutional positioning in Ultra 10-Year Futures (5 May 2020 – 26 January 2021)
Source: QuikStrike COT tool, CFTC Commitments of Traders Report
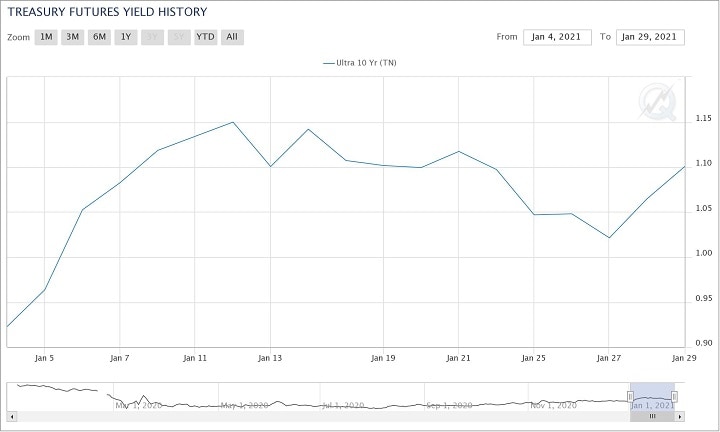
Another contributing factor has been the dynamic nature of the 10-year yield move over the last three months. In January alone, the CTD implied forward yield for Ultra 10-Year futures moved from a low near 0.90% up to 1.15% and closed the month at 1.10%. With some expecting that Treasury yields could continue to climb in 2021 alongside increased issuance, risk management at this part of the curve could become even more critical.
Exhibit 4: Ultra 10-Year Note futures CTD implied forward yield history (4 January 2021 – 29 January 2021)
Source: Treasury Analytics tool, powered by QuikStrike
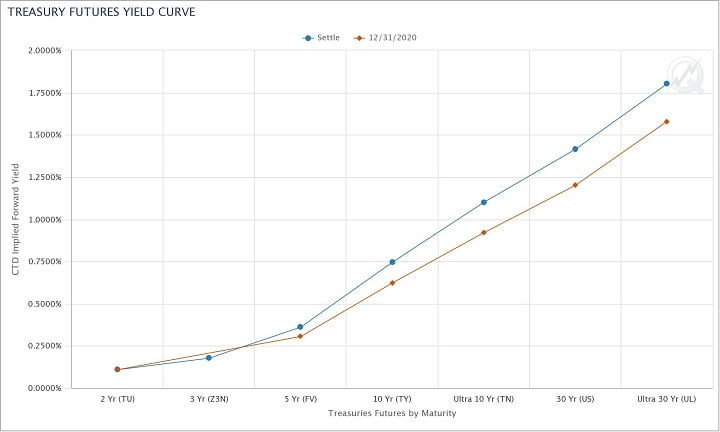
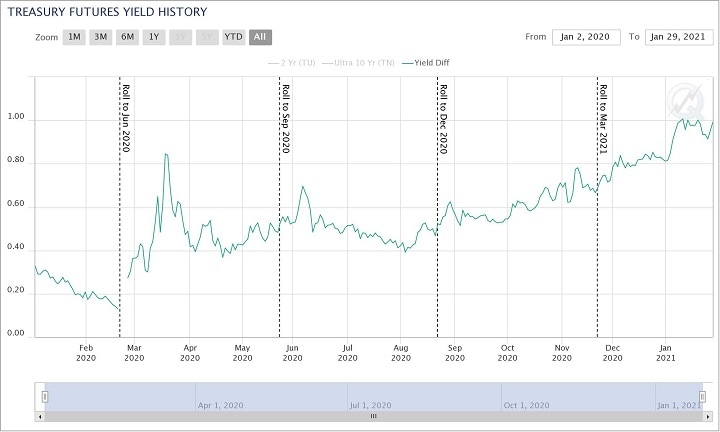
Speaking of the curve, a great amount of steepening has happened over the prior month, with Ultra 10-Year futures moving in near lock step to the long-end of the curve. The Ultra 10-Year vs. 2-Year yield spread currently sits near its 13-month high of ~1.00%, up from a recent low of 0.13% in February 2020. Increasingly, market participants are relying on inter-commodity spreads to efficiently execute yield curve spreads involving the 10-year point on the curve. For example, the TEX spread (+3 ZN, -2 TN) was the third most actively traded ICS instrument in 2020, with daily spread volume rising 24% YoY. Likewise, the NCB spread (+5 TN, -3ZB) was the fifth most active ICS in 2020. To learn more about ICS, and to view ICS volume by spread, check out our related article here.
Exhibit 5: Treasury futures yield curve change (29 January 2021 vs. 31 December 2020)
Source: CME TreasuryWatch tool, powered by QuikStrike
Exhibit 6: Ultra 10 vs. 2-Year futures yield spread (2 January 2020 – 29 January 2021)
Source: Treasury Analytics tool, powered by QuikStrike
With impressive growth over its first five years, a narrowly defined basket, a rich source of inter-commodity spreads, and more Treasury issuance to come, Ultra 10-Year Note futures appear well-primed for even greater growth ahead.
Ultra 10-Year US Treasury Note futures – Contract specs
| CONTRACT UNIT | Face value at maturity of $100,000 |
| PRICE QUOTATION | Points and fractions of points with par on the basis of 100 points |
| TRADING HOURS | Sunday - Friday 6:00 p.m. - 5:00 p.m. New York time/ET (5:00 p.m. - 4:00 p.m. Chicago Time/CT). Monday - Thursday 5:00 p.m. - 6:00 p.m. New York Time/ET (4:00 p.m. - 5:00 p.m. Chicago Time/CT) daily maintenance period. |
| MINIMUM PRICE FLUCTUATION | One-half of one thirty-second (1/32) of one point ($15.625, rounded to the nearest cent per contract), except for intermonth spreads, where the minimum price fluctuation shall be one-quarter of one thirty-second of one point ($7.8125 per contract) |
| PRODUCT CODE | CME Globex: TN CME ClearPort: TN Clearing: TN |
| LISTED CONTRACTS | The first three consecutive contracts in the March, June, September, and December quarterly cycle |
| SETTLEMENT METHOD | Deliverable |
| TERMINATION OF TRADING | Trading terminates on the 7th business day before the last business day of the contract month |
| SETTLEMENT PROCEDURES | Settlement Procedures |
| POSITION LIMITS | CBOT Position Limits |
| EXCHANGE RULEBOOK | CBOT 26 |
| BLOCK MINIMUM | Block Minimum Thresholds |
| PRICE LIMIT OR CIRCUIT | Price Limits |
| VENDOR CODES | Quote Vendor Symbols Listing |
| DELIVERY PROCEDURE | Federal reserve book-entry wire-transfer system |
| LAST DELIVERY DATE | Last business day of the contract month |
| GRADE AND QUALITY | Original issue 10-Year U.S. Treasury notes with not less than 9 years 5 months and not more than 10 years of remaining term to maturity from first day of futures delivery month. The invoice price equals the futures settlement price times a conversion factor, plus accrued interest. The conversion factor is the price of the delivered note ($1 par value) to yield 6 percent |
For More Information
Check out these related resources: