https://www.cmegroup.com/content/dam/cmegroup/education/images/articles/2018/liquidity_720x100.jpg
Interest Rate Liquidity Metrics Reach New Highs
Interest Rate Futures Liquidity Metrics Reach New Highs
The New Treasury Market Paradigm, published by CME Group in June 2016, compared the evolution of market liquidity in Treasury futures products and corresponding adjacent marketplaces. Among other findings, it confirmed the relative strengthening of Treasury futures liquidity in response to intensifying demand for off-balance-sheet means of holding Treasury note and bond exposures.
The trends it identified have gained significant momentum in the 18 months since the paper was published.
The quality of the central limit order book (CLOB), the fundamental signifier of futures market liquidity, affirms that the Treasury futures liquidity pool has deepened and grown more resilient in recent years. For all Treasury futures products, for example, best bid/offered price spreads matched corresponding contract minimum price increments throughout more than 99 percent of each trading day.
Significantly, for each Treasury futures product, CLOB depth has improved at both the best bid/offered price level, and at the top three bid/offered price levels in aggregate.
Average Central Limit Order Book Size for Treasury Futures
Something went wrong.
Outright front-month only, measured during regular trading hours (7:00 am to 4:00pm, CT)
Other liquidity metrics examined in The New Treasury Market Paradigm have continued to improve since mid-2016. Liquidity can be defined broadly as a market participant’s ability to convert assets into cash or to enter/exit a position, and is therefore proportional to indicators such as open interest, average daily trading volume, and breadth of market participation. The following summarizes recent milestones in those 3 key liquidity measures.
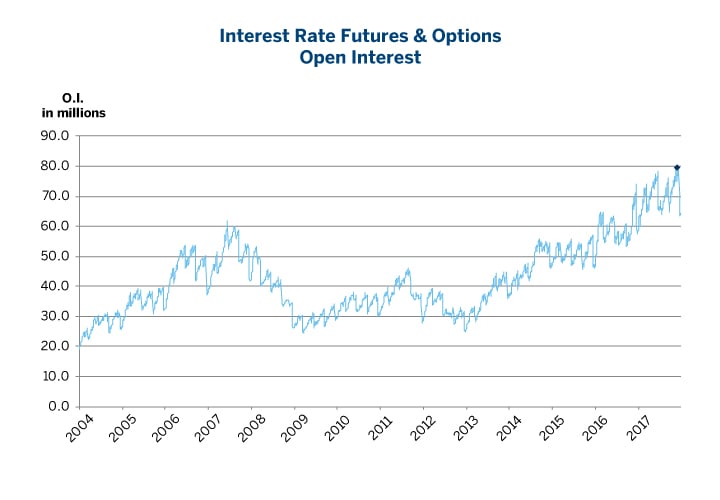
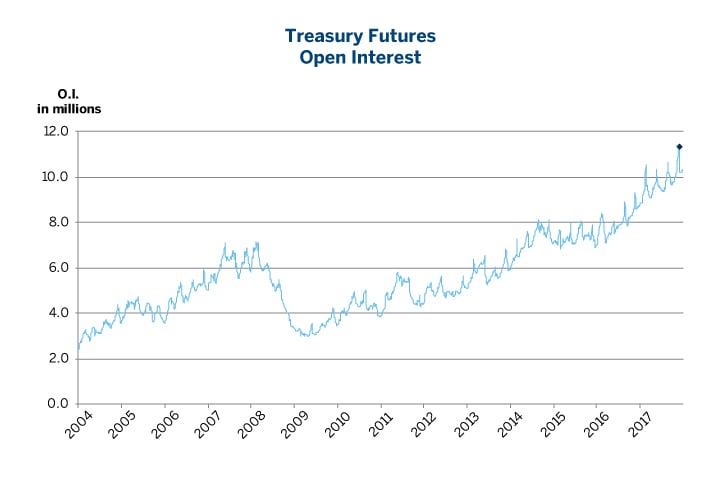
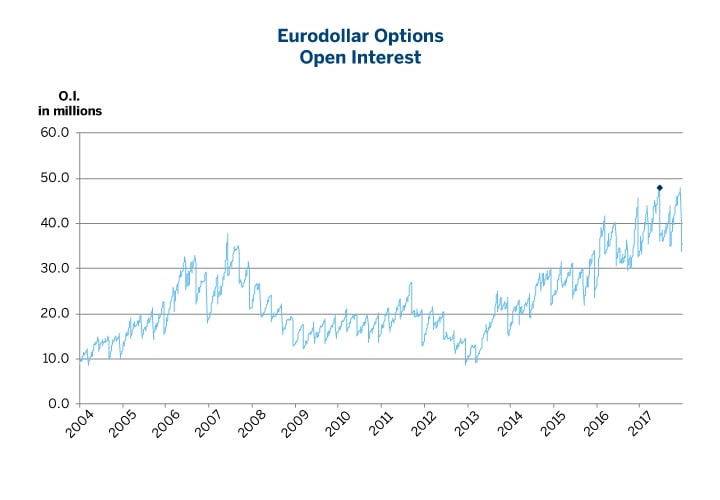
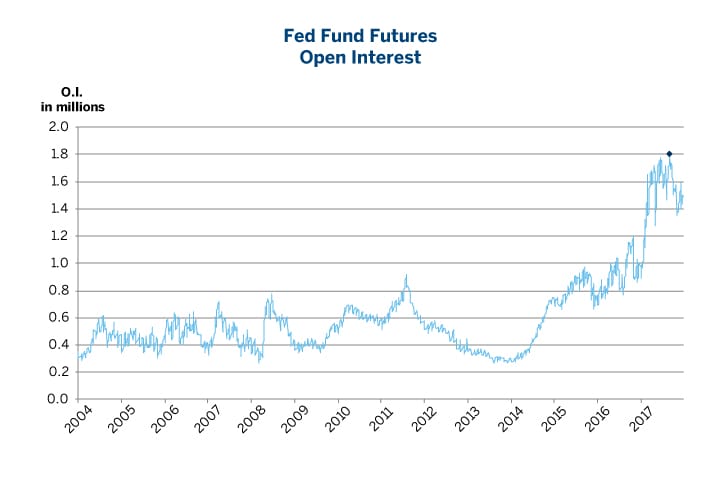
Open Interest
(OI) reliably gauges outstanding positions. From 2015 to 2016, average daily open interest (ADOI) in all CME Group interest rate products grew 15%. In 2017, ADOI grew another 17%, setting new single-day records in every product group along the way (summarized in the following table and illustrated in the following four charts)
| Product Group | 2017 ADOI | 2016 ADOI | % Growth vs 2016 | All-time Record | Date of record |
| Interest Rate F&O | 70,232,368 | 58,967,923 | 19% | 79,230,678 | 11/22/2017 |
| Eurodollar Futures | 13,096,545 | 10,940,039 | 20% | 14,430,858 | 12/13/2017 |
| Eurodollar Options | 40,449,845 | 35,048,679 | 15% | 47,963,896 | 6/15/2017 |
| Treasury Futures | 9,757,167 | 7,980,169 | 22% | 11,370,975 | 11/22/2017 |
| Treasury Options | 5,335,574 | 3,985,929 | 34% | 7,907,673 | 10/26/2017 |
| Fed Fund Futures | 1,524,868 | 922,633 | 65% | 1,801,747 | 9/1/2017 |
Aggregate Treasury futures OI set numerous single-day records, fueled by growth and single-day records in “Classic” 10-Year T-Note futures, 5-Year T-Note futures, 2-Year T-Note futures, “Ultra” 10-Year T-Note futures and Ultra T-Bond futures. Single-day open interest records were also set in 5-Year note options, 1-Year Eurodollar Mid-Curve options, 2-Year Eurodollar Mid-Curve options, and Weekly Treasury options.
https://www.cmegroup.com/content/dam/cmegroup/education/images/articles/2018/OI-Chart1_720x500-1.jpg https://www.cmegroup.com/content/dam/cmegroup/education/images/articles/2018/OI-Chart2_720x500.jpg https://www.cmegroup.com/content/dam/cmegroup/education/images/articles/2018/OI-Chart3_720x500.jpg https://www.cmegroup.com/content/dam/cmegroup/education/images/articles/2018/OI-Chart4_720x500.jpg
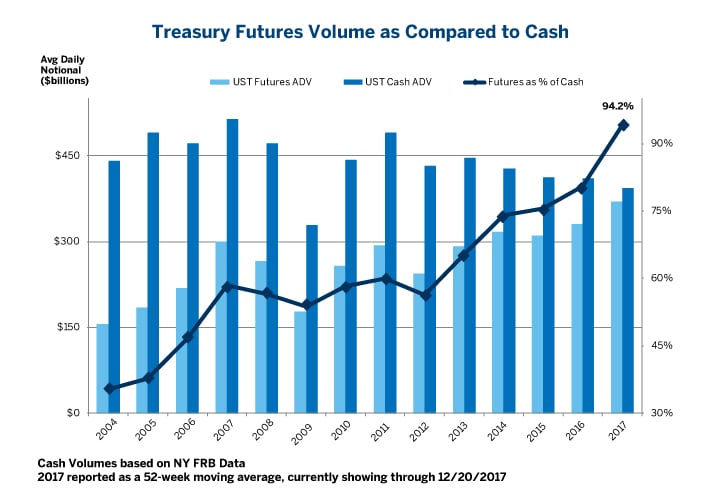
Daily Trading Volume
Various interest rate products and product sectors hit new highs in annual average daily trading volume (ADV) in 2016, in addition to posting new single-day records. In 2017, ADV grew 9% compared to 2016’s record levels, while new single-day records were reached in Treasury futures and Fed Fund futures.
| Product Group | 2017 ADV | 2016 ADV | % Growth vs 2016 | Single-Day Volume Record (contracts) |
Date of record |
| Interest Rate F&O | 8,189,337 | 7,516,642 | 9% | 26,646,985 | 11/9/2016 |
| Eurodollar Futures | 2,549,192 | 2,598,997 | -2% | 11,562,175 | 11/9/2016 |
| Eurodollar Options | 1,368,247 | 1,225,330 | 12% | 4,705,224 | 12/15/2016 |
| Treasury Futures | 3,327,895 | 2,976,801 | 12% | 13,273,069 | 11/27/2017 |
| Treasury Options | 747,825 | 577,153 | 30% | 2,026,379 | 11/10/2016 |
| Fed Fund Futures | 191,148 | 132,141 | 45% | 907,185 | 6/14/2017 |
2017 Treasury futures ADV, 3.327 million contracts, signifies $371 billion notional face value per day. That’s massive, not just in absolute terms, but also in comparison to the adjacent cash government securities market. Notional value of futures trading volume has surged to 94.2% of trading volume in cash Treasury notes and bonds, up from 80% in 2016 and 75% in 2015. Notional volume in TY and TN is now 143% of the proximate sector of the cash market (6 to 11 years).
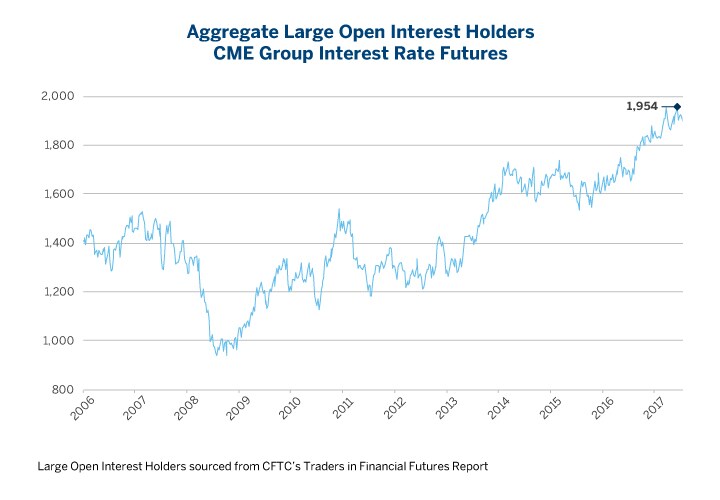
Breadth of Participation
Interest Rate futures markets have achieved increasingly broad participation by an increasingly diverse user base, as evidenced by the number of large open interest holders (LOIH) tallied in the CFTC weekly Commitment of Traders report. Aggregate LOIH, a fair proxy for overall market participation among firms holding significant positions, reached a record high of 1,954 OI holders on November 21, 2017. In 2017, new highs were also reached in Treasury futures (1,406), Eurodollar futures (345), Fed Fund futures (172), 10-Year Note futures (425), 5-Year Note futures (325), 2-Year Note futures (309), Ultra Bond futures (122) and Ultra 10-Year note futures (86).
| Reportable Position Size in contracts ($ notional) | 2016 Avg Weekly LOIH | 2017 Avg Weekly LOIH | Record LOIH on 21 Nov 2017 | |
| 10-Year Note (ZN) | 2000 ($200M) | 357 | 392 | 424 |
| 5-Year Note (ZF) | 2000 ($200M) | 288 | 306 | 325 |
| 2-Year Note (ZT) | 1000 ($200M) | 245 | 275 | 302 |
| Bond (ZB) | 1500 ($150M) | 149 | 160 | 161 |
| Ultra Bond (UB) | 2000 ($200M) | 98 | 110 | 117 |
| Ultra 10-Year Note (TN) | 1500 ($150M) | 26 | 65 | 77 |
| Eurodollar (ED) | 850 ($850M) | 276 | 306 | 310 |
| Fed Funds (ZQ) | 600 ($3B) | 129 | 151 | 156 |
| 10-Year MAC Swap (N1U) | 44 | 48 | 49 | |
| 5-Year MAC Swap (F1U) | 36 | 33 | 33 | |
| Aggregate | 1,649 | 1,846 | 1,954 |
Large Open Interest Holders sourced from CFTC’s Traders in Financial Futures Report, http://www.cftc.gov/Marketreports/CommitmentsofTraders/index.htm