Short-Term Jobs Growth Looks Robust
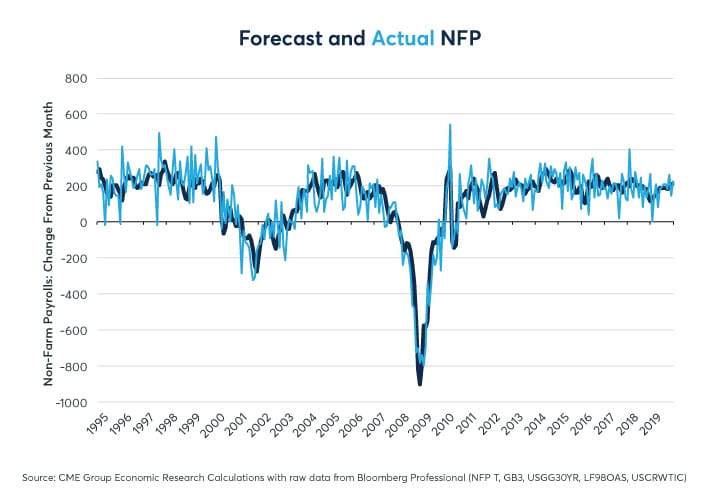
The US employment market looks set to keep pace with its strong job creation record, at least in the short term, despite the impact of the coronavirus. Our model, which explains 74% of the month-to-month variation in non-farm payrolls (NFP) (Figure 1), suggests that the US will most likely add about +215K jobs in February (to be reported on March 6) and around +230K for March (to be reported on April 3). NFP is volatile month to month; a one standard deviation error is +/-80K.
Figure 1: March employment might be around +215K
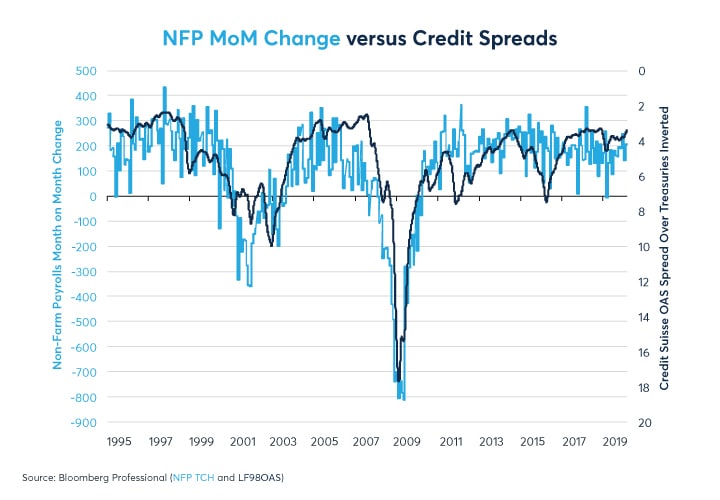
Up until the last few days of February, credit spreads, as measured by high-yield bond spreads over Treasuries, have been exceptionally narrow, suggesting strong jobs growth in the immediate future (1 to 2 months ahead). Credit spreads alone explain 60% of the month-to-month variation in NFP (Figure 2).
Figure 2: High-yield bond spreads explain 60% of the month-to-month variation in NFP
What’s more interesting than our model’s estimate of February and March employment gains is what it says about how employment might evolve during the rest of 2020 and in 2021. April, May and June numbers may be pulled in two different directions. On the one hand, credit spreads may depress job creation in Q2 while Census Bureau hiring will almost certainly boost it.
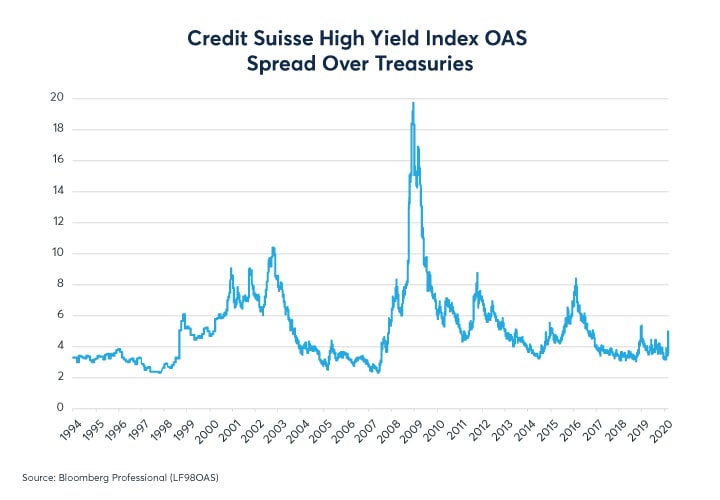
At the end of February, high-yield credit spreads widened from 3.5% over Treasuries to 5% (Figure 3). Should credit spreads remain at 5% on average over the next few months, that could slow the pace of job creation from around 215K-230K new jobs per month on average to 110K-120K, according to our model. The critical number to watch on high-yield spreads is 6.5%. Our model suggests that given the other factors (one-year average yield curve slope lagged one year, movements in oil prices, Census hiring), if credit spreads stay below 6.5%, the economy continues to add jobs; above that level of spreads, the economy is likely to see net job losses.
The model takes a daily average of credit spreads calculated over two months, lagged one month. For example, the December and January average is used to forecast the March jobs number. The January and February average is used to forecast April etc.
Figure 3: Credit spreads have widened on the recent equity selloff but remain historically narrow
Despite the risk of wider credit spreads, the April to June period should, however, benefit from a once-per-decade factor: Census hiring. To estimate hiring by the Census Bureau we use a dummy variable of +1 for the months of April, May and June, multiplied by the unemployment rate to estimate hiring for the decennial census. We then use -1 x unemployment rate for the months of July and September as the census winds down and census workers are laid off. The reason for using the unemployment rate x the dummy variable is that census hiring apparently has a much bigger impact on jobs numbers when unemployment is high (like in 2010) than when its low (like in 2000 – or 2020). This year, with unemployment at 3.6%, census hiring will probably boost the April-to-June jobs figures by around 100K per month, followed by a 100K contribution from July to September.
As such, even if credit spreads stay at 5% on average during the March to May period, April to June hiring might still be around 220K per month. Watch out, however, as the Census Bureau sheds workers in the July to September period, it will make hiring look weaker than it really is to the tune of 100K per month. So, if credit spreads were to remain around 5% on average ahead of those months, net gains in NFP could temporarily grind to a halt.
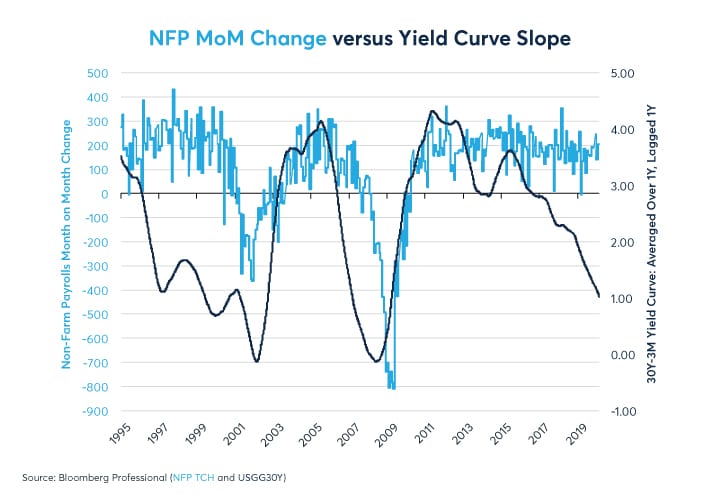
Outside of credit spreads and census hiring, the model’s other major factor suggests that US employment gains will gradually slow as a result of the exceptionally flat yield curve. The model uses the difference between 30Y Treasury yields and 3M T-Bill yields, averaged out over one year and lagged by one year. As such, for March 2020, we are using the average level of the 30Y-3M spread for the period from April 2018 to March 2019. This was a period when the average yield curve steepness was around 101 basis points (bps) – far steeper than the current level of about a 50-bps difference. The flattening that we have experienced over the past year should slow employment growth by about 40K jobs per month by this time next year. A flat yield curve combined with the possibility of wider credit spreads could significantly slow job growth going into late 2020 and in 2021.
Figure 4: The yield curve take the model’s explanatory power from 60% to 70% of monthly variance
Oil prices, the remaining factor, might buffer any job market weakness if they remain low. Low oil prices are obviously not good for energy-sector employment but are helpful to nearly every other aspect of the economy, especially transportation.
Bottom Line
- Our model explains over 70% of month-to-month changes in NFP and can forecast it over one month in advance.
- The recent coronavirus-related widening of credit spreads may slow but not halt job creation
- 6.5% high-yield bond spreads over Treasuries may be the tipping point between net job gains and losses
- The flat yield curve will likely put downward pressure on job creation next year
Equity Index Products
Fine-tune your US Equity Index exposure with our portfolio of products and capitalize on deep liquidity in futures and options on the benchmark S&P, Nasdaq-100, and Dow indices.