Trading the Treasury Yield Curve
Many traders think in terms of buying (selling) interest rate futures to capitalize on anticipated falling (rising) yields in response to changes in Fed policy or to dynamic macroeconomic conditions. Some take a more subtle approach by trading spreads between, for example, CBOT Treasury futures to capitalize on changes in the shape of the yield curve.
We offer Treasury futures that cover the broad spectrum of the yield curve including 2-, 5-, 10-year Treasury notes; as well as our “classic” 30-year and “Ultra” 30-year bond contracts.
This piece provides an overview of the factors that drive yield curve spreads as well as how one might construct these spread trades.
Shape of the Yield Curve
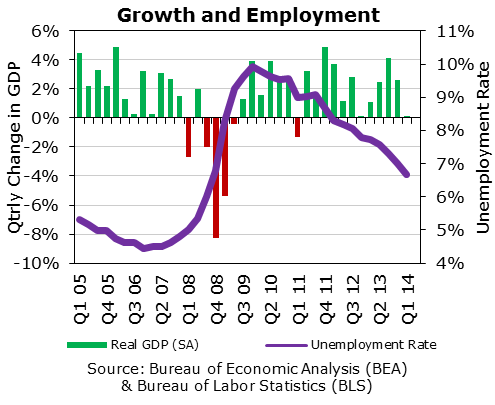
Short-term interest rates are firmly anchored by Fed monetary policy. The Fed operates per a statutory mandate to “foster maximum employment and price stability.” Thus, they focus on statistics including GDP growth, the unemployment rate and inflation indications.
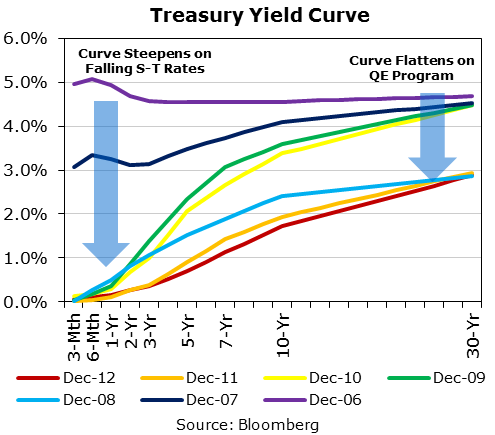
The Fed reacted decisively to the economic downturn associated with the subprime crisis by injecting massive liquidity into the system. The target Fed Funds rate was reduced in 2008 from 5¼% to the current level of zero to ¼%. This caused the yield curve to steepen as short-term rates plummeted to near zero while longer-term rates fell at a much more subdued rate in 2008 and 2009.
Intermediate- and long-term rates have, historically, been driven by market expectations of economic growth and inflation. But after the Fed moved rates (essentially) to zero, it had expended its major monetary policy bullet with little positive impact.
Thus, it followed up with more inventive methods, notably its “Quantitative Easing” (QE) programs per which it began to purchase a quota of up to $85 billion of mortgage and Treasury securities on a monthly basis. QE caused longer-term interest rates to decline.
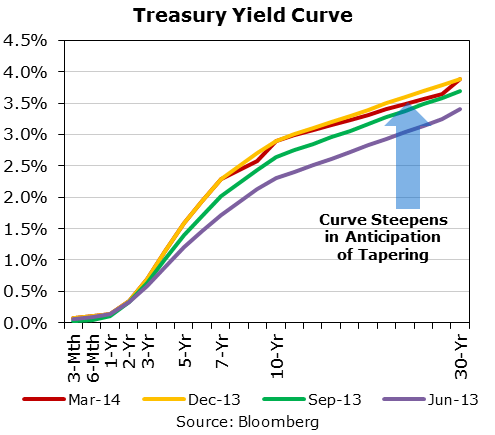
In response to improving economic conditions including moderate GDP growth and a declining unemployment rate, the Fed began to “taper” its QE program beginning in late 2013. As of this writing, the Fed has wound down its QE program to $45 billion of mortgage and Treasury securities on a monthly basis. Thus, the yield curve has begun to steepen as intermediate- to long-term rates have been allowed to rise a bit.
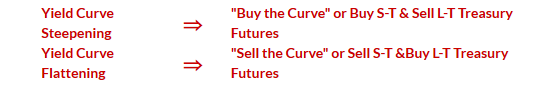
If you believed that the Fed would continue to taper its QE program while holding short-term rates near- zero, the yield curve might continue to steepen. Thus, you might wish to “buy the curve” by buying short-term and selling long-term Treasury futures – a yield curve “steepener.”
Or if you believed that the Fed might begin to tighten its target Fed Funds rate faster than tapering might permit longer-term rates to rise, then the yield curve might flatten – a yield curve “flattener.”
Weighting the Spread
Whatever your yield curve outlook, you can take advantage of your scenario by trading spreads between CBOT Treasury futures contracts.
Let’s focus on the spread between 2-year and 10- year Treasury futures contracts. This is known as the “TUT” for T wo-year U nder T en-year.
Because long-term fixed income instruments are more sensitive to changing yield levels than short- term instruments, the spread must be weighted so that the financial results reflect the change in the relative yields associated with the two contracts and not to outright movements in yield levels.
This is accomplished by weighting the spread in a ratio driven by the relative volatility of 10-year T- note futures vs. 10-year DSFs using a “hedge ratio” as follows.
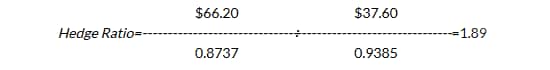
Where BPV = basis point value or the expected dollar change in value given a 0.01% or 1 basis point change in yield; CF = conversion factor of the security for delivery into futures; and, CTD = cheapest-to-deliver security into futures. You also need to recognize that the 2-year T-note futures contract is based upon a $200,000 face value unit while the 10-year T-note futures contract is based upon a $100,000 face value unit.
E.g., as of May 27, 2014, the 2-1/4% note of March 2016 was CTD vs. the June 2014 2-year T-note with a CF = 0.9385 and a BPV = $37.60 per $200,000 face value. The CTD 10-year note was the 3-5/8% of February 2021 with a CF = 0.8737 and a BPV = $66.20 per $100,000 face value. 1
The hedge ratio is calculated as 1.89, suggesting that one should trade the spread on a 19-for-10 basis. I.e., buy nineteen (19) 2-year T-note futures vs. the sale of ten (10) 10-year T-note futures. Or, one may round this to a 2-for-1 spread.2
- These numbers may be referenced at the CME Group website at http://www.cmegroup.com/trading/interest-rates/duration-flash.html. More detailed information regarding concepts such as cheapest to delivery, conversion factors and basis point values may also be found on our website.
- As of May 27, 2014, the correct ratio was 1.89. But this is often rounded to 5:3 (=1.67) contracts and recognized as qualifying for a margin break by CME Clearing House.