What’s Ailing Norway’s Krone?
Slumping Oil Output Weighs on Norway’s Krone
When seen from a US dollar (USD) perspective, the Norwegian krone (NOK) appears to be driven by two main factors: 1) the price of oil (Figure 1) and 2) the relative value of other European currencies. This isn’t too surprising given that crude oil and its refined products accounted for 56.5% of Norway’s exports in 2018 and the great majority of those exports were within Europe (8.5% to Sweden, 20% UK and 43% eurozone, and another 4% to euro-linked Denmark).
Figure 1: NOKUSD has Underperformed Oil on a Risk-Adjusted Scale in Recent Years.
Figure 2: NOKUSD has Also Underperformed SEKUSD so Far This Decade.
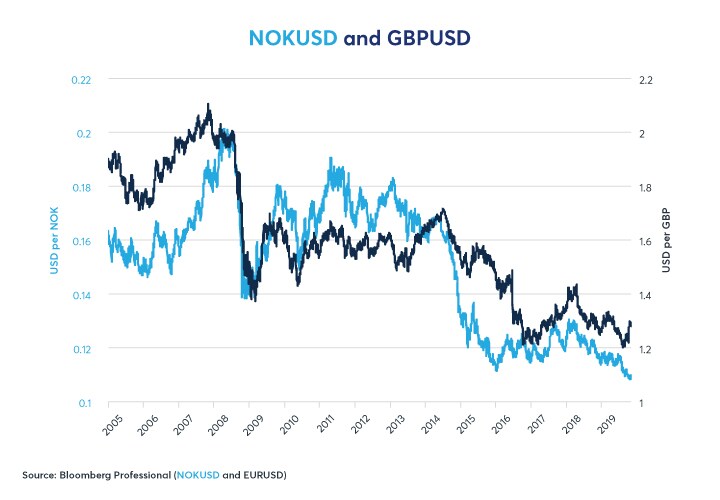
Even compared to oil and other European currencies, however, NOK has been an underperformer, especially in the past five years. This is true versus the Swedish krona (SEK) (Figure 2), euro (EUR) (Figure 3) and the British pound (GBP) (Figure 4).
Figure 3: NOKUSD has Also Somewhat Underperformed EURUSD in Recent Years.
Figure 4: Even the Brexit-Driven British Pound has Found Time to Outperform NOKUSD.
The reasons for NOK’s underperformance can’t be blamed on the usual suspects: central bank policy, excessive debt or poor economic performance. Rather, it comes down to one factor: diminishing oil production in the absence of new discoveries (Figure 5).
Figure 5: Norway’s Crude Oil Output is Down 40% Since 2005 and Down by Half From its Peak in 2000.
Falling oil production has hit export growth hard. Moreover, while oil production made Norway one of the richest countries on Earth, it also comes with a curse. While Norway’s neighbors have developed a variety of other industries including telephones, automobiles, electronics, furniture making and Legos, Norway remains heavily dependent on extractive industries such as oil, mining and fishing.
Even so, on a fundamental basis, Norway’s economy doesn’t look too bad. Its government debt totals 32% of GDP – very low by any standard. Moreover, that debt ignores the assets of the Government Pension Fund (known colloquially as the Oil Reserve Fund). Its assets total close to 200% of GDP. In essence, Norway’s total public assets minus total public debt is equal to about 165% of GDP, an extraordinary fiscal position. Household debt is high at 100% of GDP and corporate debt is a lofty 132% of GDP. That said, GDP probably isn’t the right yardstick for corporate debt since part of that corporate debt burden is supported by corporate revenues outside of Norway itself.
Norway’s $560 billion of foreign assets do present a dilemma, however. If they are repatriated, it could rally Norway’s currency, causing it to become overvalued versus its peers and hurt economic competitiveness in Norway’s non-extractive industries, which are already underdeveloped.
Figure 6: Norway’s Rate of Core Inflation has been Close to 2%, About 1% Higher than in the Eurozone.
Figure 7: Norges Bank Appears to be Sensitive to Unemployment When Setting Rates.
On a more fundamental basis, Norway’s economy is in decent shape, for the moment. Inflation is a little bit higher than the central bank, Norges Bank, might like (Figure 6). The weak currency has probably stoked a modest amount of inflation, prompting Norges Bank to tighten policy last year and in 2019. Unemployment has been falling until recently (Figure 7). However, Norway’s yield curve has been flattening and that has often been a harbinger of slower growth and rising unemployment (Figures 8 and 9). Even so, Norway’s economic situation looks more favorable than that of Sweden (see our article https://www.cmegroup.com/education/featured-reports/when-will-swedens-sinking-krona-hit-bottom.html) or the eurozone.
Figure 8: A Flat/Inverted Yield Curve Preceded Past Slowdowns and Recessions.
Figure 9: Yield Curve Slope is a Decent Indicator of Growth 1-2 Years (4-8 Quarters) in Advance.
Bottom Line
- NOK has underperformed SEK, EUR, GBP and even oil (on a risk-adjusted basis).
- Falling oil production appears to be responsible for NOK’s underperformance.
- A flat yield curve is pointing towards a significant slowdown in growth/rise in unemployment.
- Norges Bank often eases policy in the face of higher unemployment rates and might cut rates in 2020.
Energy options
From geopolitical tensions to fluctuations in demand trends, crude oil prices can change at a moment's notice. Access the world’s benchmark options for Crude Oil, Natural Gas, and Refined products around the clock.