Nikkei: Equities-Oil Correlation Set to Fade?
Two factors have primarily driven Japan’s Nikkei 225 index so far this year: 1) Strength of the yen, and 2) Oil prices. Together, they account for about 55% of the daily change in the Nikkei 225 future year to date.
Movements in the yen-dollar exchange rate have the strongest day-to-day influence. For every one percent rise in the yen, the Nikkei future tends to fall by 1.5% (Figure 1). This is not unexpected given Japan’s heavy reliance on exports, and its soft domestic demand.
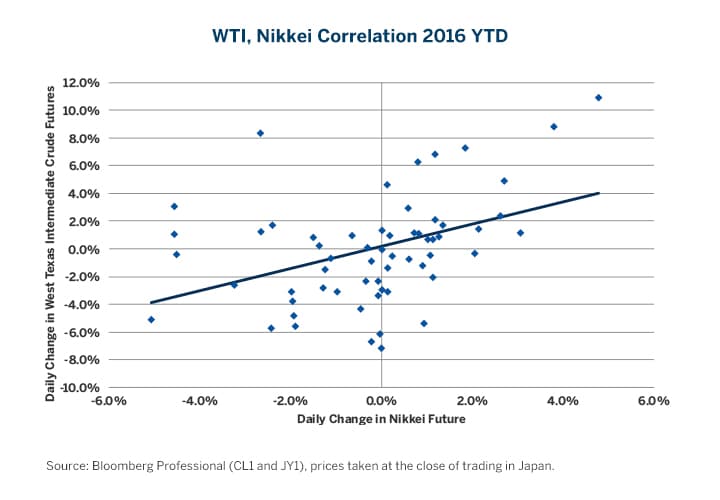
By contrast, higher oil prices appear to be good for Japanese stocks – at least so far in 2016. This may seem odd. After all, doesn’t Japan import nearly all of its crude oil needs? While it is true that Japan imports approximately 98% of its oil, Japanese equities, much like their U.S. peers, have exhibited a strong positive correlation with oil prices (Figure 2). When oil prices rise by 1%, the price of Japanese equities has risen, on average, by about 0.15%, so far this year. That may not sound like much but keep in mind that oil prices have roughly doubled since hitting bottom in February. In the absence of that rebound, the Nikkei might probably be trading 15% lower than its current level, all else being equal.
Figure 1: A Stronger Yen Tends to Exert Downward Pressure on Japanese Equities.
Figure 2: Higher Prices for West Texas Intermediate Crude Oil Have Been Positive for Japanese Stocks.
That U.S. stocks have been correlating positively with crude oil prices is not entirely surprising. The energy sector comprises 7.4% of the S&P 500®’s weight. Moreover, two other sectors -- materials stocks and financial stocks -- have shown a strong positive correlation to energy prices as well. Together, these two sectors comprise almost 20% of the S&P 500®’s weight. Other S&P 500® sectors have weaker but still positive correlations to oil.
U.S. banks have significant energy sector exposure, and investors became nervous about credit quality when oil prices fell below $30 per barrel in January and February. They breathed a sigh of relief when oil prices subsequently rebounded to the $50 level, to the benefit of both energy firms and banks.
That Japanese stocks have been correlating positively with oil is a little mysterious. Given that Japan produces almost none of its own oil, it should come as no surprise that the country lacks a large energy sector. Energy firms’ weight in the Nikkei index is slightly less than 0.5%. Moreover, financial and materials stocks account for a combined 13%, one third less than in the S&P 500®. Japan’s exposure to energy appears to be through Nikkei’s heavy weighting to industrial stocks, which account for 21.2% of the index’s weight. Some Japanese industrial firms sell equipment to oil exploration firms. Additionally, Japanese consumer goods companies export a great deal of goods, including automobiles, to energy producing nations. As such, while Japan, as a whole, generally benefits from lower energy prices, Japanese corporate profits can come under downward pressure if energy prices fall excessively and threaten the financial viability of energy services firms, as well as the ability of net oil exporters to continue consuming Japanese-made goods.
A strong positive correlation between Japanese equities and oil prices is a recent phenomenon and will probably fade as 2016 wears on. One factor that could keep the correlation strong, however, would be a retest of oil’s lows from earlier this year. This would revive concerns about financial and export-related exposures to the oil sector. Given that oil inventories continue to rise to seasonally adjusted record highs, a sharp correction in oil prices over the summer cannot be ruled out.
Longer-Term Influences
While day-to-day movements in the yen and oil have dominated movements in the Nikkei so far this year, the longer-term performance of Japanese equities is likely to be driven by other factors. Strangely, interest rates -- a factor that would have been considered to have an influence on Japanese equities – have had no impact at all in the short term. Nikkei has shown almost no correlation at all to the daily changes in Japanese Government Bonds (JGBs). Longer term, though, interest rate levels might still influence the value of Japanese stocks, although not always in the manner that one might expect.
When valuing stock markets, analysts often compare the yields on long-term bonds with the earnings yield of the equity market. In theory, lower interest rates should support higher valuations for equities. Back in 1989, when the Nikkei reached its record high near 40,000, Japanese stocks were trading at around 60x earnings. This equates to an earnings yield of just 1.6%. At that time, yields on 10-year JGBs were around 6.6%, and there was no 30-year benchmark. In short, Japanese stocks were massively overvalued relative to bonds. Since 1989, Japanese 10-year government bond futures have returned 140% in excess of the risk-free rate while Nikkei futures returned -62.5% in excess of the risk-free rate over the same period of time.
Currently, valuation levels seem almost perfectly reversed from 1989. The Nikkei has a P/E ratio of 16.1, which equates to an earnings yield of 6.2%. By contrast, Japanese 10-year bonds yield -0.15% and 30-year bonds yield 0.20%. If there is a bubble in Japan currently, it might be in fixed income and not equities. Japanese stocks appear likely to have returns close to the global average in the years ahead barring any sharp moves in the Japanese yen. By contrast, with negative yields up to the 15-year point on the yield curve, it’s hard to see how Japan’s bond bull market can continue. Owning a bond with a negative yield guarantees a loss, if the bond is held to maturity.
However, there is one way in which interest rates are impacting Japanese stocks: negative interest rates appear to be strengthening, not weakening, the yen. Since the Bank of Japan (BoJ) introduced a negative deposit rate on January 29, 2016, the yen has appreciated by over 13% against the U.S. dollar. While some of the yen’s strength can be pinned on a general weakness in the U.S. dollar, the yen has outperformed the other currencies in the Bloomberg Dollar Spot Index, a broad based basket of currencies that includes the yen, by about 9% since January 29, 2016. According to our regression model, this appreciation has helped to shave about 20% off the value of the Nikkei but that decline was partially offset by the near doubling of oil prices over the same period. The major downside risk for the Nikkei going forward would be a continued appreciation of the yen combined with lower oil prices.
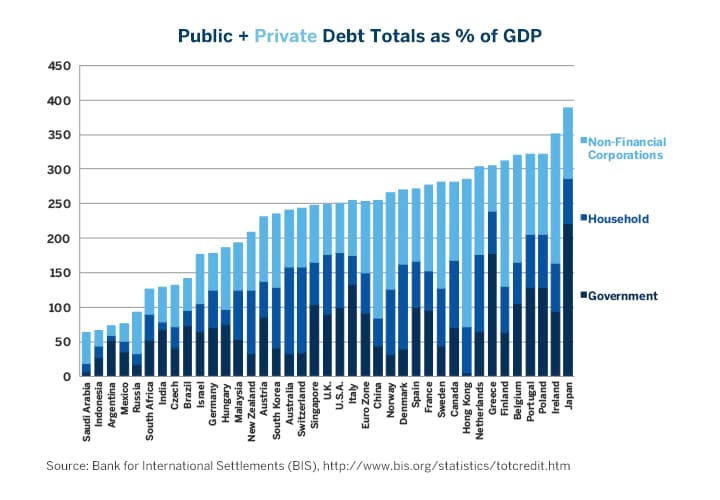
Figure 3: Japan Has a High Overall Debt Burden.
Another longer term issue for Japanese stocks is debt. One factor holding back Japanese stocks from achieving higher valuation levels is the fact that Japan has the world’s highest overall debt burden (Figure 3). While Abenomics and the BoJ’s aggressive quantitative easing programs have succeeded in returning Japan to positive nominal GDP growth, the high debt burden and seeming inability to reduce the size of its budget deficit might be making investors nervous.
Bottom Line
- Higher crude oil prices have been supportive for the Nikkei in the past few months.
- The correlation between the Nikkei and WTI probably won’t remain positive over the long term.
- A sharp correction in oil prices could, however, maintain a strong positive correlation between Japanese stocks and WTI in the short-term.
- A stronger yen has offset many of the benefits of higher oil prices.
- Negative interest rates may have strengthened rather than weaken the currency.
- Negative deposit rates act as a tax on the banking system and may contract rather than expand money supply.
- High debt burdens may also weigh on Japanese equity markets.
- On an outright basis, Japanese stocks have unexceptional valuation levels.
- Japanese stocks look inexpensive compared to Japanese government bonds.
All examples in this report are hypothetical interpretations of situations and are used for explanation purposes only. The views in this report reflect solely those of the authors and not necessarily those of CME Group or its affiliated institutions. This report and the information herein should not be considered investment advice or the results of actual market experience.
Recommended For You
View this article in PDF format.