Effective Management of Major Event Risk
Futures and options are critical tools for market participants seeking to hedge risk – from commercial firms with exposure to physical commodities to financial institutions managing their exposure in equity markets. As markets evolved out of an unusually low volatility period, many products have seen the return of pre-2017-style volatility in response to policy changes and geopolitical turmoil. The risks posed by these events have had varying impacts on individual markets, but traders across all products and regions sought relevant futures and options products to limit their impact.
To fully understand the impact on markets and their participants, we examined a few events that were key drivers of global volatility. While these events were specific to certain region and the products they impacted, they share some key features. In particular, these events resulted in large market moves as they were either largely unexpected by most market participants or were known events that resulted in surprising outcomes.
At times, the effects of these events are not felt on a global level even though they do shift volatility in certain individual markets; indeed, many of these events came and went without a meaningful shift in the overall volatility regime. However, such moves can create significant risks for trading firms. With expectations for this period of uncertainty to continue, as the Federal Reserve continues to tighten policy, the outcome of Brexit still up in the air ahead of its March 2019 deadline, the European Central Bank expected to begin raising rates next year, disruption of emerging market currencies with heavy debt loads and geopolitical tensions remain largely unresolved, market participants will need to rely on risk management tools and robust market data to navigate through markets.
Open Interest and Event Risk
Our analysis indicates that significant moves in volume and price come at the end of a series of record open interest days. Typically, higher open interest is an indication that market participants see an increasing risk of event-driven disruption in markets and a growing need to hedge against the potential for sharp price breaks. Larger-than-usual positions in options on Treasuries suggest that traders continue to expect that certain global events will create pricing opportunities and challenges in the market. This can occur whether the market is facing an event with a known decision date (i.e. elections or interest rate decisions) or a buildup of uncertainty in anticipation of abrupt changes (i.e. ongoing global tensions).
If and when these events are triggered – an election is called or a simmering trade dispute explodes – markets react quickly, elevating volume and creating price gaps – a sudden surge or plunge in prices with no trading in between. As traders attempt to hedge their risk against the eventual outcome of such an event, they tend to open options positions in advance of the event, increasing open interest in the options products.
Below, we look at a few core products that have been impacted by recent events. Individual moves in these products are discussed in the following sections, but each saw significant open interest growth in advance of the event date. It’s likely that traders in these markets saw the risk of significant price gaps in the wake of upcoming events and sought to limit their exposure to the more extreme potential outcomes.
U.S. Treasury Options
In recent years, U.S. Treasury futures have faced additional risks, including rising interest rates after a long period of near-zero rates. In response, traders flocked to options to hedge against quick changes as the market adjusts to new rates and increased debt burdens. As a result, the 10-year Treasury option set a series of records in open interest during the last few years. Most recently, May 29, 2018, saw the largest volume day in CME history, with activity largely driven by a contract roll date coinciding with worrying news out of the eurozone. This came just a week after two of the year’s highest open interest dates, May 23 and 24.
In general, the top 10 days for open interest in 10-year Treasury options in 2018 have been steadily higher than the records set in 2017. Most of the overall records have been set in 2018, in February and May.
Figure 1
Copper Options
Copper is widely viewed as an indicator of global economic health. China has a voracious appetite for the metal and accounts for about 40-50% of the world’s annual consumption.1 As the U.S. administration continued to impose tariffs against China, with threats for more, traders are anticipating the risk of a slowdown in the Chinese economy and its consumption of copper. The downside risk for copper has led to a dramatic increase in copper option open interest since autumn 2017. Our analysis illustrates one day of trade-war related price gaps in April 2018, and markets seem to believe that this will not be the last stress-point on copper prices.
April 2018 began with a war of words between U.S. and Chinese administrations as their leaders threatened additional and more targeted tariffs on imports. On April 5th, the U.S. administration announced its intention to set tariffs on $100 billion of Chinese imports. Markets, already the wiser from the copper market’s reaction to the potential impact of these threats on the Chinese economy, saw this as a real risk to Chinese resilience to the trade war and thus further increased their options holdings to prepare for trade-related market downturns.
Figure 2
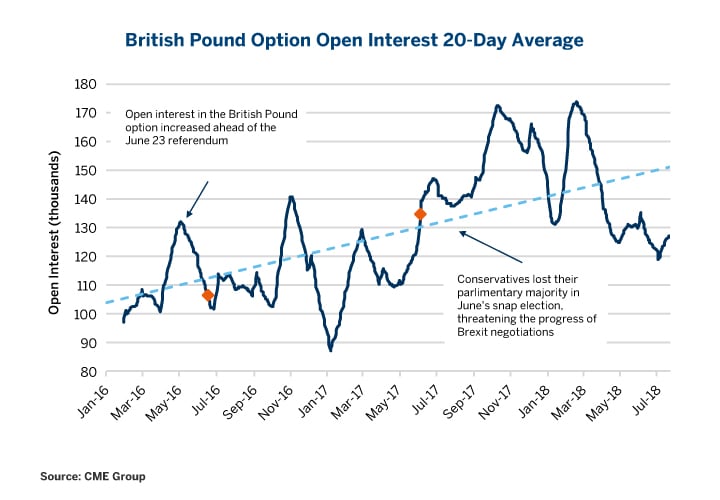
British Pound Options
In the lead up to the vote on the UK referendum in June 2016, traders began building open interest in British pound options to prepare for the currency’s response to the result. While the vote was the initial trigger for this event risk, ambiguity of the British government’s goals in negotiations and the growing risk of a “hard Brexit” with no pre-agreed deal with the European Union since the Brexit vote have sustained the uncertainty in the currency. As traders seek to hedge their exposure to the pound and the uncertainty of the market, open interest in options has grown.
Figure 3
June 24, 2016: Brexit Vote
In the lead up to the June 2016 vote, polls predicted a very close race, but many public figures felt that a vote for the UK to leave the European Union was unlikely. Even so, financial firms prepared for significant market moves, keeping staff overnight to manage their exposures in equities and foreign exchange regardless of outcome. The media blackout of political news in the 24 hours ahead of polls closing gave markets little information to execute on during the vote itself. However, as the results rolled in, shortly after polls closed at 10 pm local time, markets began to respond to the dramatic outcome and the expected aftermath of the UK leaving the EU.
British Pound Futures
The British pound was one of the largest movers in response to the vote. As the outcome became clear, around 2 am local time, the pound fell markedly and with it GBP futures as markets absorbed the news of the outcome and its implications for the British currency. Volume remained elevated for the rest of the trading day as traders sought to hedge their risk against this unexpected and uncertain outcome.
Volatility in the pound had been building in the weeks leading up to the vote, but receded as markets prepared to manage the long road between the vote and the UK’s formal exit from the EU.
Figure 4
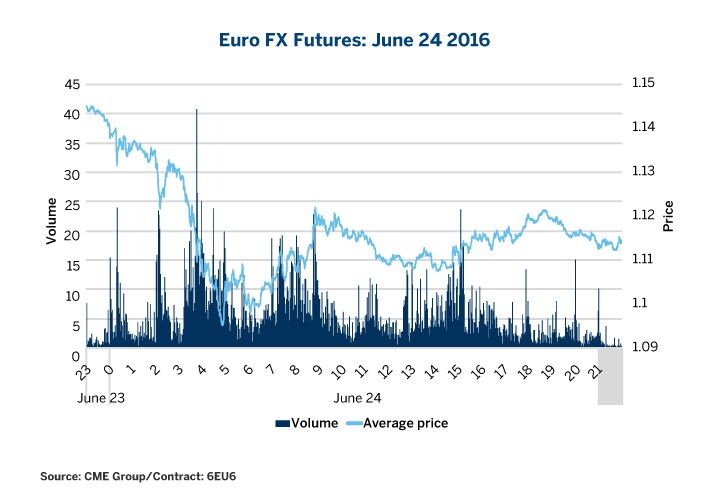
Euro FX Futures
With the results of the UK referendum, the EU was set to lose its second largest economy, suggesting the potential for economic turmoil in the region. The expected impact on the euro was reflected in the futures, which lost more than 4% before making a small recovery. Volume was elevated throughout the European and U.S. trading hours, though the price stayed within a relatively normal range, allowing participants around the world to execute their trades to hedge the risk of this unexpected event.
Figure 5
Allied Markets
Several other markets responded to the Brexit vote, especially as traders sought security in the traditionally safe haven of gold and U.S. treasuries. Other traditional barometers of market health, such as WTI crude, suffered losses in the wake of the vote.
Many CME products saw elevated volume in response to the referendum vote, but most returned to a state of general calm after the initial spike in volatility waned. However, this vote was just the starting salvo in what would become a season of unexpected political risk, resulting in increased volatility and uncertainty across markets.
November 9, 2016: U.S. Presidential Elections
The results of the 2016 U.S. Presidential elections surprised most experts and defied probability models even as polls had tightened in the weeks leading up to the election on November 8. Markets in general were caught on the back foot, leading to significant movements across equities and rates in the early hours of the next day.
As markets responded to the news of the change in administration, many staples in the futures space saw dramatic moves that were largely reversed by the end of the U.S. trading day. This reflected markets’ taking in the impact of the electoral news and adjusting their expectations of the new administration. This dynamic response to the unexpected results highlights the flexibility and reliability of futures markets for participants seeking to hedge risk against a changing news cycle. Core products saw record volumes and tight bid/ask (“B/A”) spreads throughout the trading day, during U.S. hours and beyond.
E-mini S&P Futures
Markets reeled in response to the unexpected results of the 2016 presidential elections, with E-mini S&P 500 futures falling more than 6% before ending the day higher. While the drop in price was in response to the shock of the news, equities ultimately recovered as traders considered the potential for a business-friendly administration and promised tax cuts. Volumes were elevated throughout the day as traders worked to protect their exposure.
Figure 6
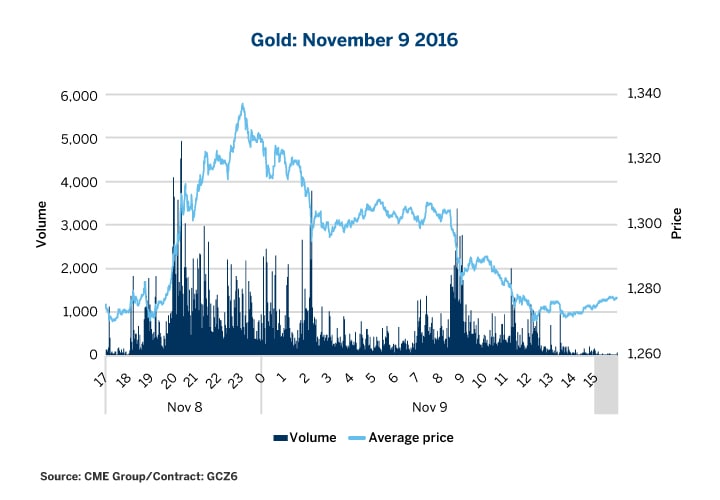
Gold Futures
A perennial favorite during times of uncertainty, the response from gold in terms of price and volume was almost exactly the opposite to S&P 500’s movement for the day. As news built that the election result may be unexpected, gold prices and volume ticked up, with prices spiking 5% higher. This was the result of traders flocking to the security of gold as the news pointed towards potential volatility in the markets. However, as participants began to consider the policy positions of the incoming administration, the gold price reverted to close nearly unchanged on November 9.
Figure 7
6 February 2018: Volatility Returns
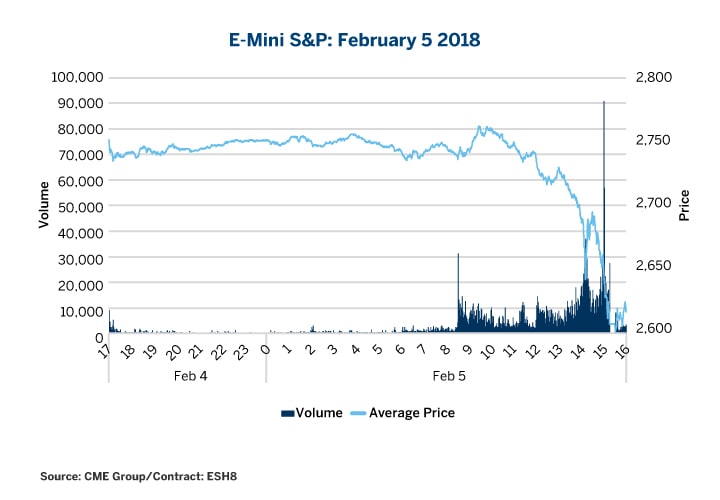
E-Mini S&P Futures Day 1
As markets got caught up in fears of inflation and the subsequent risk of rising interest rates sparked by a strong jobs report, volatility returned to the equities markets for the first time since 2016. While volatility was comparatively lower than previous spikes, market reaction was strong, with prices swinging 7% compared to less than 2% during the presidential election. This was likely due, in part, to the long period of low volatility that preceded it, resulting in what could be considered an overreaction by nervous participants.
The reaction could be seen over two trading days. The first, February 5, 2018, ended with prices sinking 6%, with nearly all of the activity occurring at the end of the U.S. trading day.
Figure 8
E-Mini S&P Futures Day 2
Markets largely rebounded on February 6, with prices gaining 7%, erasing the losses on Feb 5. Volumes remained high as participants continued to hedge risk against the surprise return of volatility, even as prices stabilized.
Figure 9
April 4, 2018: China responds to U.S. Tariffs
While the temperature of trade tensions between the U.S. and China gradually increased throughout 2018, the response from markets had been relatively muted. Until April, Chinese responses to the U.S. administration’s tariff threats had been vague and less severe than that of America’s. This changed in April 2018 when China announced concrete plans to retaliate with $50 billion of tariffs on American imports. The specificity of the Chinese plan led market participants to take these threats more seriously, sending futures in related commodities reeling.
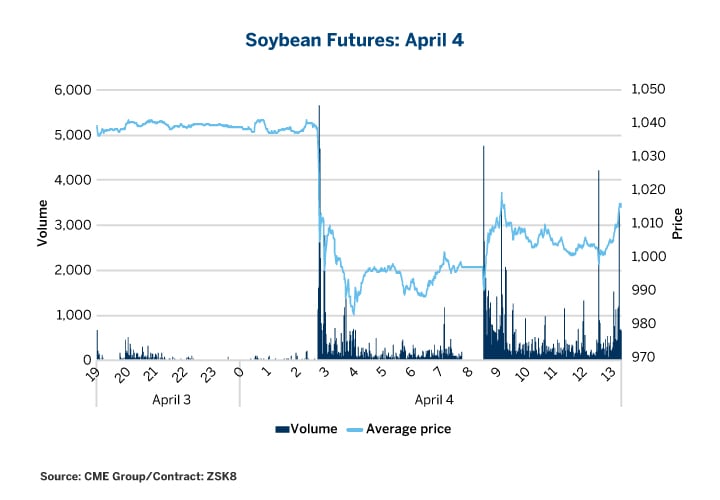
Soybean Futures
China remains the largest export market for American-grown soybeans and China’s tariffs and proposed tariffs seem to have been intentionally set on products that would cause the most economic pain, including soybeans.2 The announcement of China’s response to American tariff threats resulted in a dramatic day for markets, with soybean futures falling 5.5% and volume spiking to record highs as participants sought to hedge their risk.
Figure 10
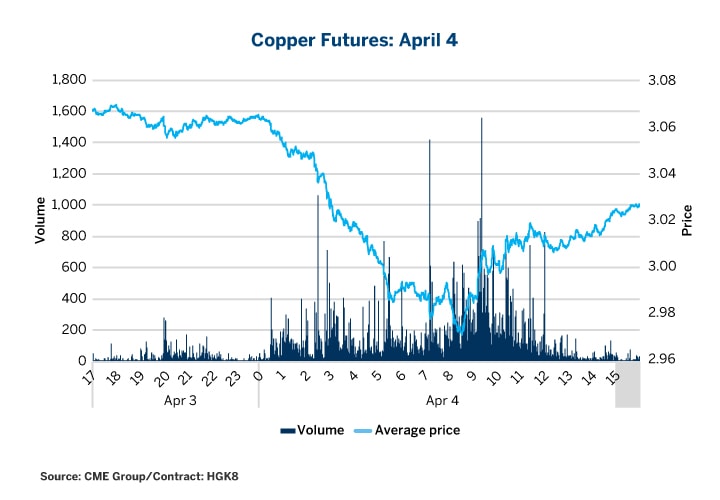
Copper Futures
China is a major importer of copper and accounts for about half of the world’s total copper consumption.3 The commodity is sensitive to economic indicators and is often referred to as “Dr. Copper” in reference to its ability to reflect the health of the global economy.4 While copper volumes do not appear to have responded much to trade tensions, futures prices fell precipitously on news of the Chinese tariffs, losing more than 3% over April 4. Still, participants in CME’s markets were able to hedge their risk as spreads remained relatively tight throughout the trading day.
Figure 11
May 9, 2018: U.S. Leaves the Iran Deal
WTI Futures
While the U.S. administration had threatened to pull out of the Iran nuclear deal months ahead of announcing its exit and reintroducing sanctions against Tehran, markets still reacted as though the decision was somewhat unexpected. The U.S. leaving the deal may result in Iran, the fifth largest oil producing country in the world,5 being unable to sell its oil, severely limiting supply. The official announcement of the pullout was scheduled for 2 pm EST, but the message was preemptively released to news outlets around 11 am EST, leading to the considerable fall in prices.
Initially, prices lost 3%, but ultimately ended the day nearly flat from the open. There was a slight tightening of intraday liquidity as markets took in the news of the decision, but this corrected quickly, and traders were able to execute to manage their risk and energy exposures.
Figure 12
May 29, 2018: Flight to Safety
While the election of Italy’s nationalist government did not cause significant moves in global markets, the surprise rejection of the government’s finance minister appointment, due to his anti-Euro position, revealed greater uncertainty in the currency and region. Markets responded by flocking to safe haven products to secure their exposures and mitigate their overall risk.
U.S. Treasury Futures
The news broke during a major roll date in the 10-Year Treasury futures and just as markets were ramping up in advance of the expected U.S. rate rise at the mid-June meeting of the Federal Reserve’s Federal Open Market Committee. This confluence of events created a unique and unexpected mix of risks for traders to hedge against. Participants around the world took positions in 10-Year Treasury Note futures, driving record volumes.
As activity increased dramatically, spreads on the contract remained tight throughout the day, even ahead of U.S. trading hours. Yield on the 10-Year Treasury Note futures dropped below 3% but prices on futures did not move significantly until the end of the day, in part due to the deep liquidity pools available on CME’s 10-Year Treasury Note futures.
Figure 13
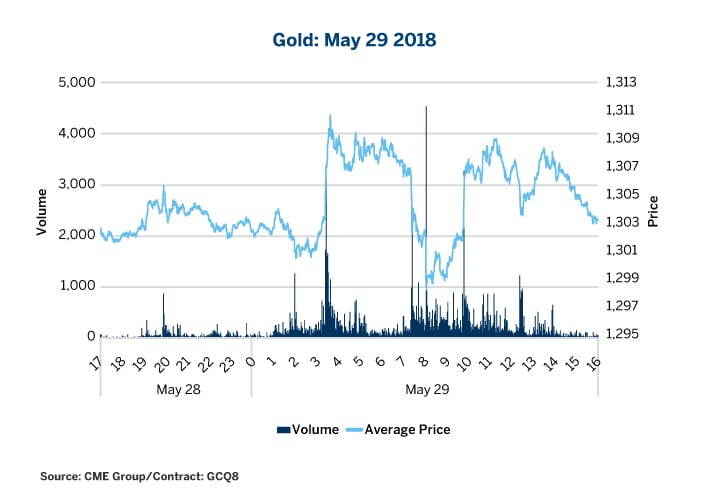
Gold Futures
The flight to quality continued in gold futures, which surged in response to the uncertainty, resulting in the highest one day volume in 2018. More so than the escalating trade war, the surprise of instability in the Eurozone and strong market reaction drove traders to the relative safety of gold futures. Prices oscillated 1% before closing essentially flat, but, much like the 10-Year note, spreads were tight throughout the day, ensuring participants could execute the trades they needed to cover their risk.
Figure 14
- https://www.cmegroup.com/education/copper-value.html
- https://www.ers.usda.gov/topics/crops/soybeans-oil-crops/trade/
- https://www.cmegroup.com/2017/11/16/chinese-traders-a-growing-force-in-global-copper-trading-markets.html
- https://www.cmegroup.com/education/featured-reports/copper-economic-risks-ahead-and-options-downside-skew.html
- https://www.eia.gov/tools/faqs/faq.php?id=709&t=6
Bottom Line
- Significant moves in volume and price can be seen at the end of a series of record open interest days.
- Individual events can have a significant impact on specific markets, even as the overall volatility regime remained low.
- Uncertainty has developed in several markets, as geopolitical tensions simmer and central banks roll out monetary policy changes.
- Risk management tools and robust market data will continue to be critical to market participants looking to navigate uncertain markets.
- The CME Liquidity Tool offers insights into liquidity and cost-of-trade efficiencies.
Try the Liquidity Tool
Assess market liquidity across asset classes with the Liquidity Tool that tracks the three vital components of book depth, bid-ask spread and the cost to trade across time zones. When is it best to trade a certain number of contracts in a particular product from anywhere in the world? Ask the tool.