https://www.cmegroup.com/content/dam/cmegroup/images/common/default/article-940x600.jpg
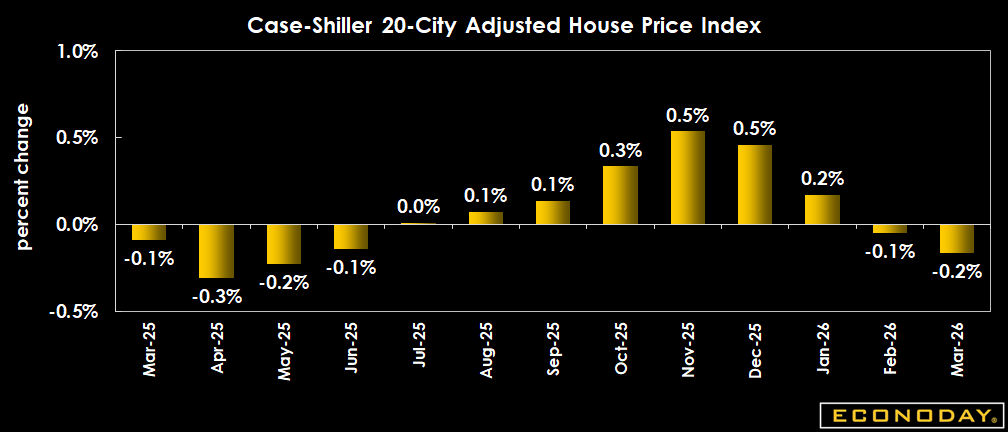
US: Case-Shiller Home Price Index
| Consensus | Consensus Range | Actual | Previous | |
| 20-City Adjusted - M/M | 0.1% | -0.1% to 0.1% | -0.2% | -0.1% |
| 20-City Unadjusted - M/M | 1.0% | 0.4% | ||
| 20-City Unadjusted - Y/Y | 1.0% | 0.3% to 1.2% | 0.8% | 0.9% |
Highlights
House price inflation comes in at 0.8 percent on year in March, below the 1.0 percent Econoday consensus forecast for the 20-city measure, and down from 0.9 percent in February. This shows disinflation continuing in shelter costs, a relief to the Federal Reserve and financial markets in need of lower price pressure to offset inflation elsewhere.
S&P Case Shiller notes a negative trend for price performance among the 20 major markets with more than half now showing outright price declines from a year ago. That shows a"broadening and deepening" housing slowdown. The split applies by geography with the Sun Belt and West (especially Seattle) showing price declines on year and the South and Northeast seeing increases.
On the month, spring selling season lifts not seasonally adjusted prices by 1.0 percent in March from February but seasonally adjusted prices are down 0.2 percent on the month.
Market Consensus Before Announcement
Housing price increases remain muted with Case-Shiller expected up only 1.0 percent in March after a similar 0.9 percent in February.
Definition
The S&P Corelogic Case-Shiller home price index tracks monthly changes in the value of residential real estate in 20 metropolitan regions across the nation. Composite indexes and regional indexes measure changes in existing home prices and are based on single-family home resales. Condominiums and co-ops are excluded as is new construction. Note that forecasters, in line with recommendations from Standard & Poor's questioning the accuracy of seasonal adjustments, track both seasonally adjusted and not seasonally adjusted monthly data for this indicator.
Description
Home values affect much in the economy - especially the housing and consumer sectors. Periods of rising home values encourage new construction while periods of soft home prices can dampen housing starts. Changes in home values, and the ability to draw upon expanding lines of home equity loans, play key roles in consumer spending and in consumer financial health.
Beginning with the onset of the subprime credit crunch in mid-2007 and with it a downturn in home prices, the ability of borrowers to refinance their debt into affordable fixed rate mortgages was sharply constrained. This in turn limited aggregate consumer spending and contributed to the depth of the Great Recession. From their peak in late 2006 and early 2007 to their nadir in mid-2012, Case-Shiller's home price indexes fell nearly 50 percent. The subsequent recovery proved slow but steady with the indexes finally surpassing their prior highs in early 2018.