https://www.cmegroup.com/content/dam/cmegroup/images/common/default/article-940x600.jpg
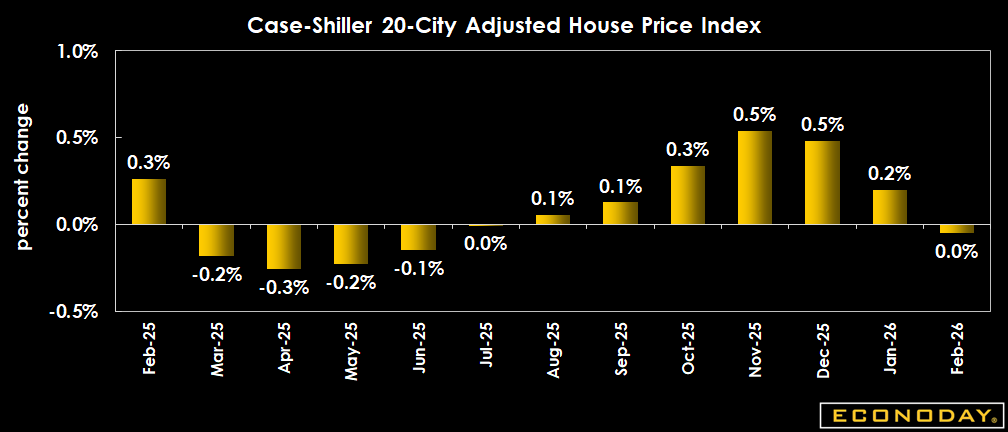
US: Case-Shiller Home Price Index
| Actual | Previous | |
| 20-City Adjusted - M/M | -0.1% | 0.2% |
| 20-City Unadjusted - M/M | 0.4% | -0.1% |
| 20-City Unadjusted - Y/Y | 0.9% | 1.2% |
Highlights
S&P Case-Shiller reports annual house price inflation at 0.9 in February versus 1.2 percent in January for the 20-city measure as the rate of housing price increases continues trending down. These are well below overall inflation which has been running near 3 percent.
More than half of major U.S. metropolitan markets report year-over-year price declines in February, with Denver (minus 2.2%) displacing Tampa as the weakest market and Los Angeles and Washington joining the list of decliners. S&P Case-Shiller says the results show the housing slowdown broadening from its Sun Belt origins to take in the Mountain West, Pacific Northwest, plus specific cities.
The 20-city adjusted index is down 0.05 percent on the month in February from January, seasonally adjusted. The unadjusted month on month figure rises 0.4 percent.
Meanwhile the Case-Shiller national index, covering all nine U.S. census divisions, sees a 0.7 percent rise in February from a year ago compared with 0.8 percent in January.
Definition
The S&P Corelogic Case-Shiller home price index tracks monthly changes in the value of residential real estate in 20 metropolitan regions across the nation. Composite indexes and regional indexes measure changes in existing home prices and are based on single-family home resales. Condominiums and co-ops are excluded as is new construction. Note that forecasters, in line with recommendations from Standard & Poor's questioning the accuracy of seasonal adjustments, track both seasonally adjusted and not seasonally adjusted monthly data for this indicator.
Description
Home values affect much in the economy - especially the housing and consumer sectors. Periods of rising home values encourage new construction while periods of soft home prices can dampen housing starts. Changes in home values, and the ability to draw upon expanding lines of home equity loans, play key roles in consumer spending and in consumer financial health.
Beginning with the onset of the subprime credit crunch in mid-2007 and with it a downturn in home prices, the ability of borrowers to refinance their debt into affordable fixed rate mortgages was sharply constrained. This in turn limited aggregate consumer spending and contributed to the depth of the Great Recession. From their peak in late 2006 and early 2007 to their nadir in mid-2012, Case-Shiller's home price indexes fell nearly 50 percent. The subsequent recovery proved slow but steady with the indexes finally surpassing their prior highs in early 2018.