https://www.cmegroup.com/content/dam/cmegroup/images/common/default/article-940x600.jpg
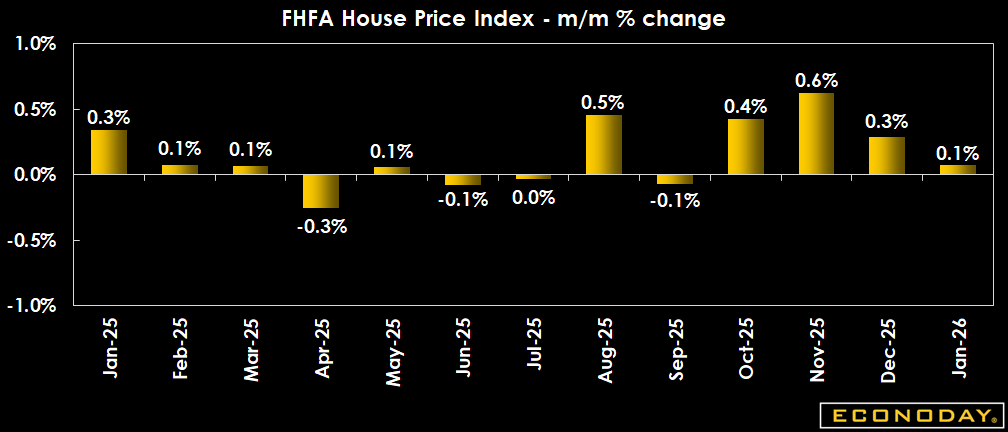
US: FHFA House Price Index
| Actual | Previous | Revised | |
| Month over Month | 0.1% | 0.1% | 0.3% |
| Year over Year | 1.6% | 1.8% | 1.9% |
Highlights
The seasonally adjusted FHFA house price index for January is up 0.1 percent compared to December after an upward revision to up 0.3 percent in December from November. The year-over-year increase in the index is 1.6 percent in January for home resales and refinancing. This is the slowest annual increase since1.7 percent in March 2012 which was the first annual rise in the index after the housing market crash in 2007.
There may be some weather impact on these numbers. January was a weak month for home shopping and sales due to widespread bitter cold temperatures and heavy winter storms. Nonetheless, a moderation in home prices could be good news for the spring home buying season and may offset some of the uptick in mortgage rates in the process of deciding to purchase.
The unadjusted FHFA house price index is down 0.2 percent in January from December and down 0.3 percent in December from November. The year-over-year increase in the price of an existing home or valuation for refinancing is up 1.6 percent.
Definition
The Federal Housing Finance Agency (FHFA) House Price Index (HPI) covers single-family housing, using data provided by Fannie Mae and Freddie Mac. The House Price Index is derived from transactions involving conforming conventional mortgages purchased or securitized by Fannie Mae or Freddie Mac. In contrast to other house price indexes, the sample is limited by the ceiling amount for conforming loans purchased by these government-sponsored enterprises (GSE). Mortgages insured by the FHA, VA, or other federal entities are excluded because they are not"conventional" loans. The FHFA House Price Index is a repeat transactions measure. It compares prices or appraised values for similar houses.
Description
Home values affect much in the economy - especially the housing and consumer sectors. Periods of rising home values encourage new construction while periods of soft home prices can dampen housing starts. Changes in home values, and the ability to draw upon expanding lines of home equity loans, play key roles in consumer spending and in consumer financial health.
Beginning with the onset of the subprime credit crunch in mid-2007 and with it a downturn in home prices, the ability of borrowers to refinance their debt into affordable fixed rate mortgages was sharply constrained. This in turn limited aggregate consumer spending and contributed to the depth of the Great Recession. From its peak in 2007 to its nadir in 2011, FHFA's house price index fell nearly 30 percent. The subsequent recovery proved slow but steady with the index finally surpassing its prior highs in 2016.