https://www.cmegroup.com/content/dam/cmegroup/images/common/default/article-940x600.jpg
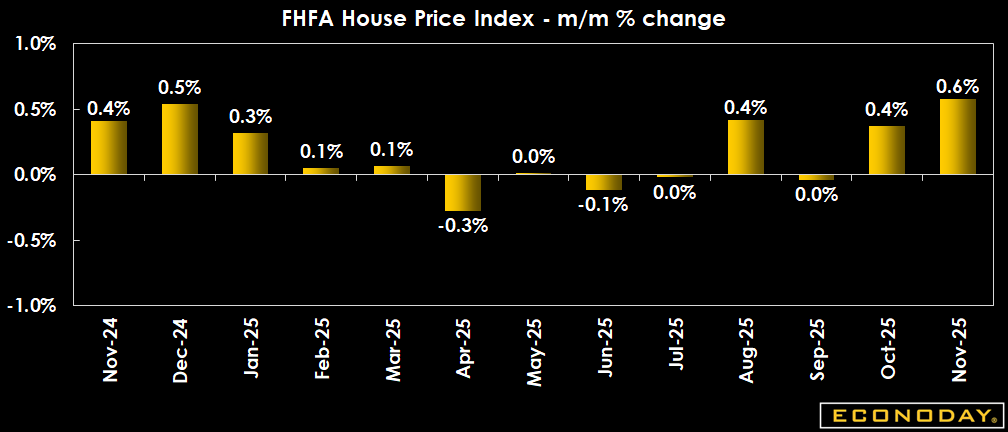
US: FHFA House Price Index
| Actual | Previous | |
| Month over Month | 0.6% | 0.4% |
| Year over Year | 1.9% | 1.7% |
Highlights
The seasonally adjusted FHFA house price index is up 0.6 percent in November from October and up 0.4 percent in October from September. The annual increase in the index is 1.9 percent from November 2024 and 1.7 percent from October 2024. Although home resales were at a softer pace before mortgage rates started to decline sharply in December, home valuations remained solid for home sellers and those refinancing current loans.
It is typical for home prices to rise in the first half of the year and steadily moderate in the second half. However, in 2025, activity in the higher end of the housing market and limited inventory of the more sought-after units led to prices increasing slightly toward the end of the year. With the Freddie Mac average rate for a 30-year fixed rate mortgage hovering just above the 6-percent mark, competition for available housing stock will increase and push prices up, as well as bringing in more refinancing activity as some current homeowners move to take out equity.
The unadjusted house price index for November is up 0.1 percent in November from October and down 0.1 percent in October from September. The year-over-year increase for November is 2.0 percent after 1.8 percent in October.
Definition
The Federal Housing Finance Agency (FHFA) House Price Index (HPI) covers single-family housing, using data provided by Fannie Mae and Freddie Mac. The House Price Index is derived from transactions involving conforming conventional mortgages purchased or securitized by Fannie Mae or Freddie Mac. In contrast to other house price indexes, the sample is limited by the ceiling amount for conforming loans purchased by these government-sponsored enterprises (GSE). Mortgages insured by the FHA, VA, or other federal entities are excluded because they are not"conventional" loans. The FHFA House Price Index is a repeat transactions measure. It compares prices or appraised values for similar houses.
Description
Home values affect much in the economy - especially the housing and consumer sectors. Periods of rising home values encourage new construction while periods of soft home prices can dampen housing starts. Changes in home values, and the ability to draw upon expanding lines of home equity loans, play key roles in consumer spending and in consumer financial health.
Beginning with the onset of the subprime credit crunch in mid-2007 and with it a downturn in home prices, the ability of borrowers to refinance their debt into affordable fixed rate mortgages was sharply constrained. This in turn limited aggregate consumer spending and contributed to the depth of the Great Recession. From its peak in 2007 to its nadir in 2011, FHFA's house price index fell nearly 30 percent. The subsequent recovery proved slow but steady with the index finally surpassing its prior highs in 2016.