https://www.cmegroup.com/content/dam/cmegroup/images/common/default/article-940x600.jpg
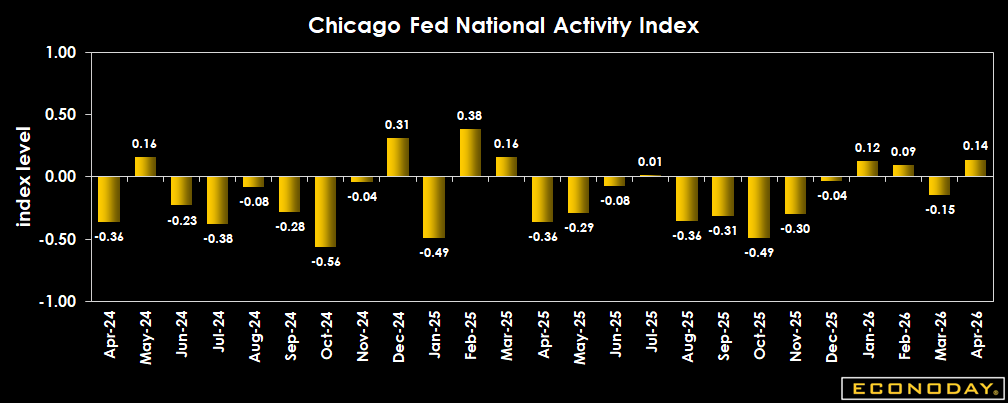
US: Chicago Fed National Activity Index
| Consensus | Consensus Range | Actual | Previous | Revised | |
| Index | -0.10 | -0.30 to 0.30 | 0.14 | -0.20 | -0.15 |
| 3-Month Moving Average | 0.03 | -0.03 | -0.02 |
Highlights
The Chicago Fed national activity index tops expectations at 0.14 in April, up from a revised minus 0.15 in March (previously reported at minus 0.20). Expectations called for minus 0.10. Among index components production and sales are stronger in April while employment and comsumption/housing are weaker.
The 3-month moving average comes at 0.03 in April versus minus 0.02 in March (previously reported at minus 0.03). This index was at 0.06 in April 2025.
The results reflect a divided showing across sectors as 2 of 4 components made positive contributions while the other 2 made negative contributions to the total index.
Here are the results by index component:
PRODUCTION +0.18 IN APRIL VS -0.13 IN MARCH (PREV -0.20)
SALES, ORDERS, INVENTORIES +0.02 IN APRIL VS -0.03 IN MARCH (PREV -0.01)
EMPLOYMENT -0.02 IN APRIL VS 0.00 IN MARCH (PREV +0.02)
The Chicago Fed says,"Periods of economic expansion have historically been associated with values of the CFNAI-MA3 above 0.70 and the CFNAI Diffusion Index above 0.35. Conversely, periods of economic contraction have historically been associated with values of the CFNAI-MA3 below 0.70 and the CFNAI Diffusion Index below 0.35."
CONSUMPTION & HOUSING -0.04 IN APRIL VS 0.00 IN MARCH (PREV -0.01)
Definition
The Chicago Fed National Activity Index (CFNAI) is a monthly index that tracks overall economic activity and inflationary pressures. The CFNAI is a weighted average of 85 existing monthly indicators of national economic activity. It is constructed to have an average value of zero and a standard deviation of one. Since economic activity tends toward trend growth over time, a positive index reading corresponds to growth above trend and a negative index reading corresponds to growth below trend.
Description
This index is unique among regional Federal Reserve Bank indexes in that it is national in scope. Investors are eager to have insight into economic growth and inflation. This index combines 85 diverse and already released indicators from four broad categories -- production and income; employment, unemployment, and hours; personal consumption and housing; and sales, orders, and inventories -- into an overall index to measure economic performance. The index provides another measure with which investors can measure overall growth.