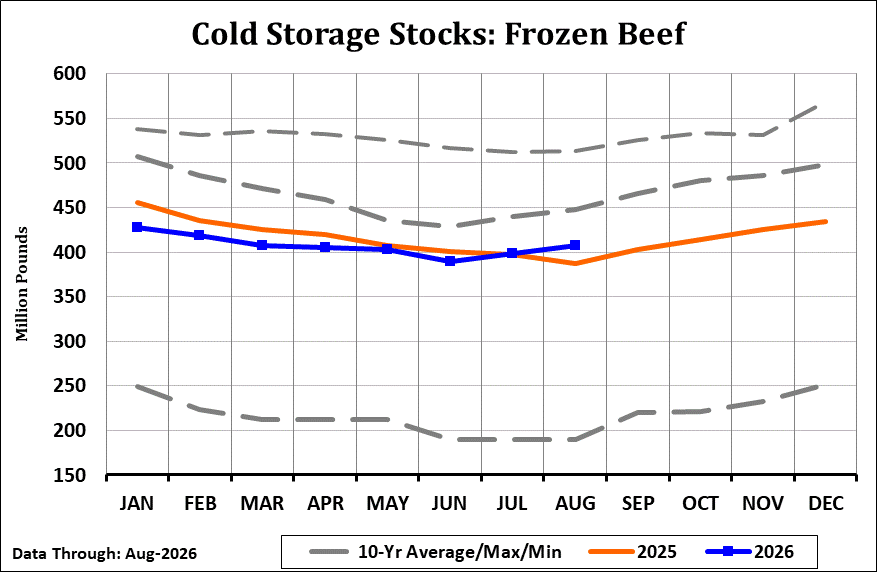
| Frozen Beef in Cold Storage - Recent History | |||||
| Stocks All In (Million Lbs) | Percent Of | ||||
| Month End | Current Year | Year Ago | Year Ago | Month Ago | 10 Year Average Change |
| Apr-26 | 405.470 | 419.232 | 96.7% | 99.6% | 97.4% |
| May-26 | 403.048 | 407.813 | 98.8% | 99.4% | 94.8% |
| Jun-26 | 388.879 | 400.262 | 97.2% | 96.5% | 98.7% |
| Jul-26 | 398.285 | 397.803 | 100.1% | 102.4% | 102.4% |
| Aug-26 | 407.115 | 387.127 | 105.2% | 102.2% | 101.7% |
| Sep-26 | - | 402.960 | - | - | 104.4% |
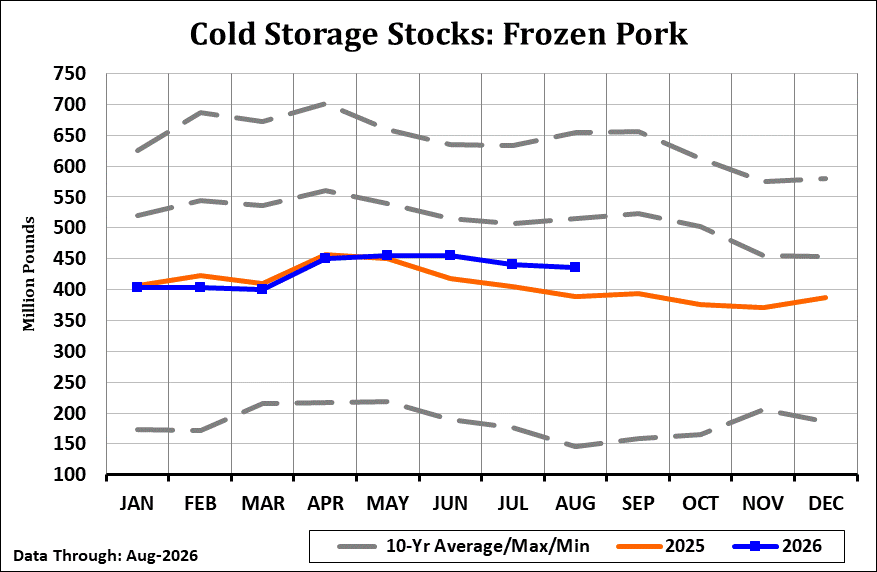
| Frozen Pork in Cold Storage - Recent History | |||||
| Stocks All In (Million Lbs) | Percent Of | ||||
| Month End | Current Year | Year Ago | Year Ago | Month Ago | 10 Year Average Change |
| Apr-26 | 451.013 | 456.182 | 98.9% | 112.5% | 97.4% |
| May-26 | 455.020 | 450.756 | 100.9% | 100.9% | 94.8% |
| Jun-26 | 455.034 | 418.695 | 108.7% | 100.0% | 98.7% |
| Jul-26 | 439.829 | 404.631 | 108.7% | 96.7% | 102.4% |
| Aug-26 | 436.269 | 389.411 | 112.0% | 99.2% | 101.7% |
| Sep-26 | - | 393.319 | - | - | 101.5% |
Definition
This file contains the regional and national end-of-month stocks of meats, dairy products, poultry products, fruits, nuts, and vegetables in public, private and semi-private refrigerated warehouses. The file also contains the record highs years and quantities of frozen fruit and juice, vegetables, potatoes, red meat, and commodities in cold storage.
Description
This can be an important report for the live cattle and lean hog markets and can move the markets the day after the report is released. It offers monthly supply data on frozen beef and pork and as such can provide insight as to demand for live cattle and lean hogs. There is a tendency for beef stocks to decline into the summer months and reach a peak in December or January. Pork supplies tend to peak in the spring and bottom in late summer. Storage has increased in recent decades as US pork and to some degree beef exports have increased.