| US Soybean Crush (Million Bushels) | |||||
| Monthly Total | |||||
| Date | Current | Last Year | Average | Max / Year | Min / Year |
| Sep-25 | *204.951 | 186.503 | 172.817 | 204.951 / 2025 | 134.563 / 2015 |
| Oct-25 | **236.346 | 215.783 | 201.467 | 236.346 / 2025 | 170.134 / 2015 |
| Nov-25 | *220.506 | 210.041 | 196.268 | 220.506 / 2025 | 165.784 / 2015 |
| Dec-25 | *229.865 | 217.701 | 200.157 | 229.865 / 2025 | 167.044 / 2015 |
| Jan-26 | *227.980 | 212.555 | 197.759 | 227.980 / 2026 | 160.468 / 2016 |
| Feb-26 | *214.212 | 189.577 | 179.737 | 214.212 / 2026 | 151.411 / 2017 |
| Mar-26 | *231.800 | 206.755 | 197.871 | 231.800 / 2026 | 160.765 / 2017 |
| Apr-26 | *217.511 | 202.385 | 183.537 | 217.511 / 2026 | 150.315 / 2017 |
| May-26 | *213.114 | 203.704 | 187.808 | 213.114 / 2026 | 156.077 / 2015 |
| Jun-26 | - | *196.925 | 174.230 | 196.925 / 2025 | 148.229 / 2017 |
| Jul-26 | - | *205.174 | 182.068 | 205.174 / 2025 | 153.451 / 2016 |
| Aug-26 | - | *198.035 | 170.914 | 198.035 / 2025 | 140.626 / 2016 |
| Daily Crush Pace (Mbu / Day) | |||||
| Date | Current | Last Year | Average | Max / Year | Min / Year |
| Sep-25 | *6.832 | 6.217 | 5.761 | 6.832 / 2025 | 4.485 / 2015 |
| Oct-25 | *7.624 | 6.961 | 6.499 | 7.624 / 2025 | 5.488 / 2015 |
| Nov-25 | *7.350 | 7.001 | 6.542 | 7.350 / 2025 | 5.526 / 2015 |
| Dec-25 | *7.415 | 7.023 | 6.457 | 7.415 / 2025 | 5.389 / 2015 |
| Jan-26 | *7.354 | 6.857 | 6.379 | 7.354 / 2026 | 5.176 / 2016 |
| Feb-26 | **7.650 | 6.771 | 6.372 | 7.650 / 2026 | 5.332 / 2016 |
| Mar-26 | *7.477 | 6.670 | 6.383 | 7.477 / 2026 | 5.186 / 2017 |
| Apr-26 | *7.250 | 6.746 | 6.118 | 7.250 / 2026 | 5.011 / 2017 |
| May-26 | *6.875 | 6.571 | 6.058 | 6.875 / 2026 | 5.035 / 2015 |
| Jun-26 | - | *6.564 | 5.807 | 6.564 / 2025 | 4.941 / 2017 |
| Jul-26 | - | *6.619 | 5.873 | 6.619 / 2025 | 4.950 / 2016 |
| Aug-26 | - | *6.388 | 5.513 | 6.388 / 2025 | 4.536 / 2016 |
| Data begins May 2015 after USDA NASS started publication. Average, Max and Min calculations look at USDA NASS data only. ** = New All-Time High / * = New High for that month of the year | ^^ = New All-Time Low / ^ = New Low for that month of the year. | |||||
| US Soybean Oil Stocks - Crude & Once Refined (Billons of Pounds) | ||||||||
| Current Crop Year | History Since 2015 | |||||||
| Date | Current | Year Ago | Year Ago % Change | Average | Max | Max Year | Min | Min Year |
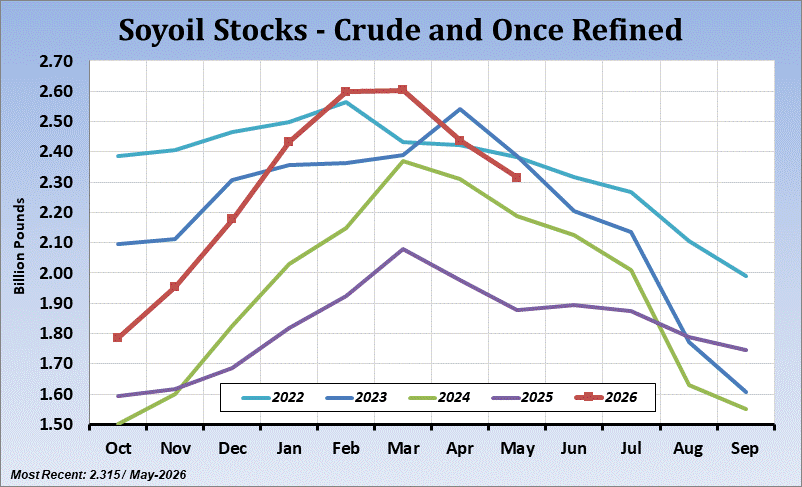
| Oct-25 | 1.786 | 1.592 | +12.19% | 1.908 | 2.386 | 2021 | 1.502 | 2023 |
| Nov-25 | 1.955 | 1.618 | +20.83% | 1.970 | 2.406 | 2021 | 1.599 | 2023 |
| Dec-25 | 2.177 | ^1.687 | +29.05% | 2.079 | 2.466 | 2021 | 1.687 | 2024 |
| Jan-26 | 2.433 | ^1.817 | +33.90% | 2.201 | 2.500 | 2022 | 1.817 | 2025 |
| Feb-26 | *2.599 | ^1.924 | +35.08% | 2.261 | 2.599 | 2026 | 1.924 | 2025 |
| Mar-26 | *2.603 | ^2.080 | +25.14% | 2.303 | 2.603 | 2026 | 2.080 | 2025 |
| Apr-26 | 2.436 | ^1.976 | +23.28% | 2.286 | 2.689 | 2018 | 1.976 | 2025 |
| May-26 | 2.315 | ^1.876 | +23.40% | 2.196 | 2.466 | 2016 | 1.876 | 2025 |
| Jun-26 | - | ^1.894 | - | 2.203 | 2.424 | 2016 | 1.894 | 2025 |
| Jul-26 | - | ^1.874 | - | 2.121 | 2.384 | 2018 | 1.874 | 2025 |
| Aug-26 | - | 1.788 | - | 1.927 | 2.215 | 2018 | 1.629 | 2024 |
| Data begins May 2015 after USDA NASS started publication. | ||||||||
Highlights
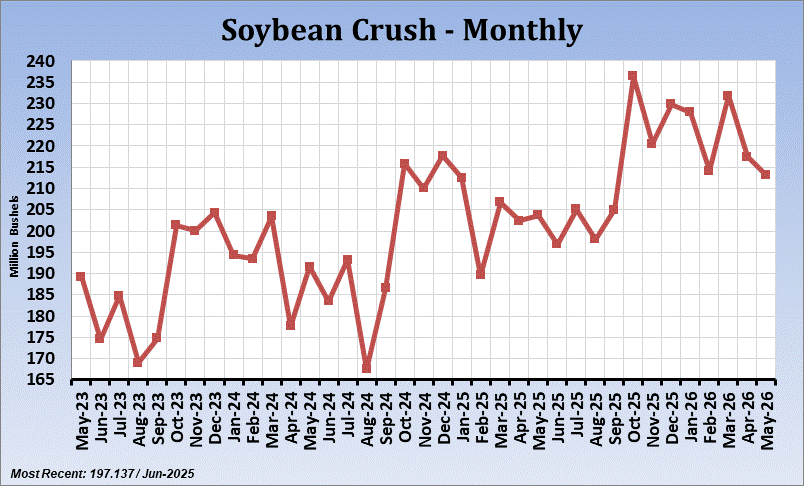
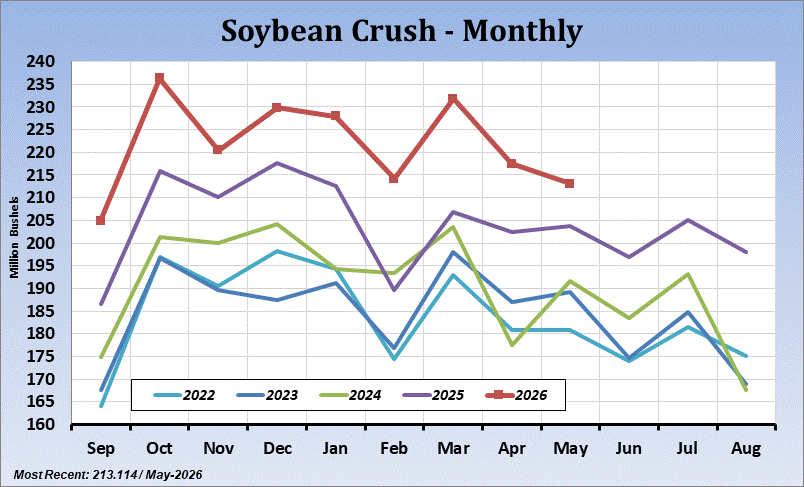
US soybean crush hit a new record high for the month of May at 213.114 million bushels. This was below the low-end of pre-report estimates. The May average is 187.808 million bushels. US soybean crush pace hit a new record high for the month of May at 6.875 million bushels. The May average crush pace is 6.058 million bushels per day.
The cumulative crush for the marketing year has reached 2.00 billion bushels 75.3% of the USDA's current estimate for the marketing year. As of May last year, the cumulative crush had reached 75.5% of the USDA forecast of 1.85 billion bushels.
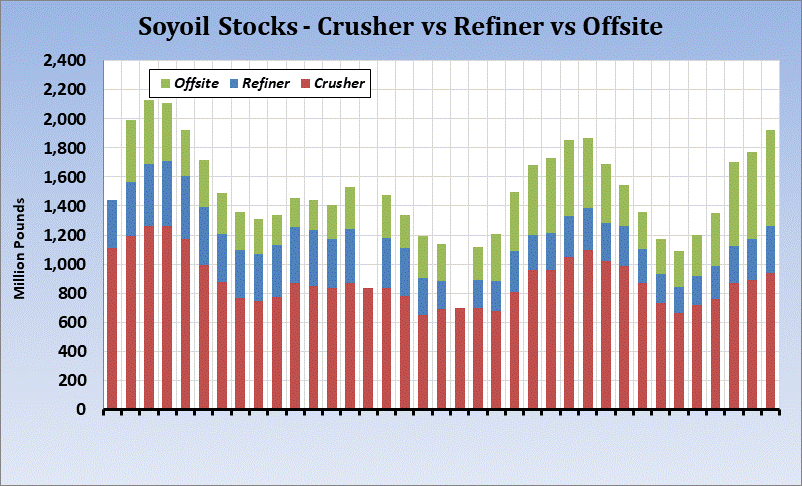
US soybean oil stocks (crude + once refined) in May came in at 2.315 billion pounds versus 2.436 last month and 1.876 last year. The average stock level for this time of year is 2.196 billion pounds. The largest stock level for this month was 2.466 (2016) and lowest was 1.876 (2025).
Definition
This monthly release is part of the Current Agricultural Industrial Report (CAIR) program, and covers the crush of oilseeds and production of crude oil for selected states and the U.S. as well as U.S. production and consumption of selected fats and oils for edible and inedible uses. The end-of-month stock values by oilseed are also published. The report is compiled from data from facilities regarding oilseed crushing, crude oil production, once refined oil production, rendering production, and end of month stocks for the previous calendar month.
Description
This report offers processing data for oilseeds, including soybeans. It also offers supply data for soybean oil.
The soybean crush data measures the amount of soybeans that are processed (crushed) during a given month. Crush is the primary demand component for soybeans. Analysts like to track the monthly crush data as the marketing year progresses and compare it with previous years and with the pace needed to reach the USDA’s forecast. If the crush is running behind pace, trader may expect the USDA to lower their forecast in future Supply/Demand (WASDE) reports.
The soybean oil stocks data measures the amount in storage at the end of the month. If stocks are unusually high, analysts may become concerned about oversupply, and they may also become concerned that demand is not as strong as expected. Likewise, if oil stocks are lower than expected, analysts may be alerted to stronger than expected demand. In recent years there have been times when the soybean crush was running at a record pace and soybean oil stocks were declining. This was because soybean oil exports were strong. Biodiesel is another component for soybean oil demand.