| Weekly Export Inspections Summary | |||||||
| Soybeans - 2025-26 Marketing Year | |||||||
| Pace to Hit | Cumulative | Percent of USDA Est. | Current | ||||
| Week Ending | Current | USDA Est. | Current | Yr. Ago | Current | 5 Year Avg. | in Million Bu. |
| Jul-09 | 418,592 | 415,227 | 38,285,458 | 46,444,732 | 92.5% | 91.1% | 15.381 |
| Jul-02 | 542,355 | 417,421 | 37,851,735 | 46,292,799 | 91.5% | 90.7% | 19.928 |
| Jun-25 | 443,820 | 431,806 | 37,298,689 | 45,892,170 | 90.2% | 90.1% | 16.308 |
| Jun-18 | 272,141 | 433,571 | 36,848,469 | 45,654,991 | 89.1% | 89.6% | 9.999 |
| Jun-11 | 533,438 | 417,733 | 36,595,914 | 45,452,600 | 88.5% | 89.1% | 19.600 |
| Corn - 2025-26 Marketing Year | |||||||
| Pace to Hit | Cumulative | Percent of USDA Est. | Current | ||||
| Week Ending | Current | USDA Est. | Current | Yr. Ago | Current | 5 Year Avg. | in Million Bu. |
| Jul-09 | 1,539,718 | 1,649,320 | 72,207,908 | 57,833,443 | 85.5% | 78.2% | 60.616 |
| Jul-02 | 1,734,997 | 1,647,376 | 70,574,970 | 56,519,141 | 83.6% | 76.7% | 68.304 |
| Jun-25 | 1,816,927 | 1,652,215 | 68,881,976 | 54,955,195 | 81.6% | 75.0% | 71.529 |
| Jun-18 | 1,467,624 | 1,666,342 | 67,082,437 | 53,574,252 | 79.4% | 73.4% | 57.778 |
| Jun-11 | 1,650,180 | 1,649,010 | 65,614,168 | 52,070,171 | 77.7% | 71.3% | 64.965 |
| Wheat - 2026-27 Marketing Year | |||||||
| Pace to Hit | Cumulative | Percent of USDA Est. | Current | ||||
| Week Ending | Current | USDA Est. | Current | Yr. Ago | Current | 5 Year Avg. | in Million Bu. |
| Jul-09 | 373,611 | 412,213 | 1,892,675 | 2,289,113 | 9.0% | 9.4% | 13.728 |
| Jul-02 | 146,824 | 411,678 | 1,505,892 | 1,844,482 | 7.1% | 7.1% | 5.395 |
| Jun-25 | 397,561 | 406,763 | 1,332,932 | 1,321,549 | 6.3% | 5.7% | 14.608 |
| Jun-18 | 396,114 | 405,858 | 971,031 | 844,968 | 4.6% | 4.3% | 14.555 |
| Jun-11 | 358,098 | 406,078 | 554,075 | 590,086 | 2.6% | 2.6% | 13.158 |
Highlights
BEANS
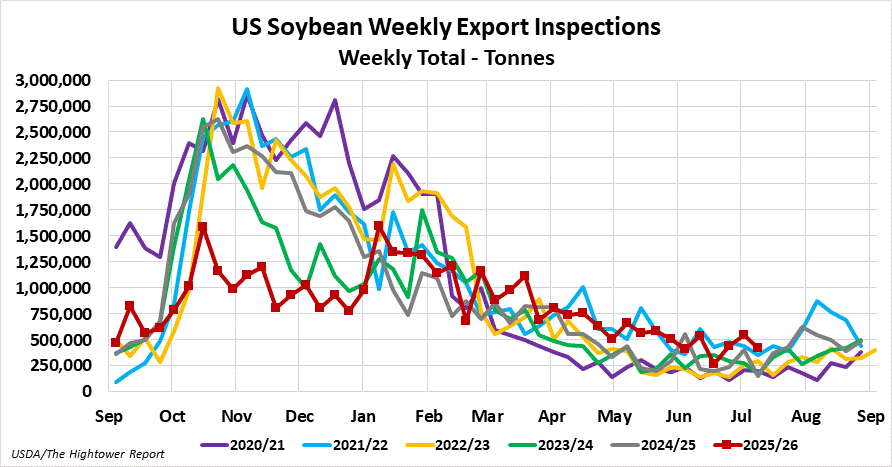
Soybean export inspections for the week ending July 9 came in at 418,592 metric tonnes. Cumulative inspections year-to-date are 38,285,458 metric tonnes which is 17.6% below last year. This is 92.5% of the USDA's forecast for the 2025-26 marketing year versus the five year average of 91.1%.
CORN
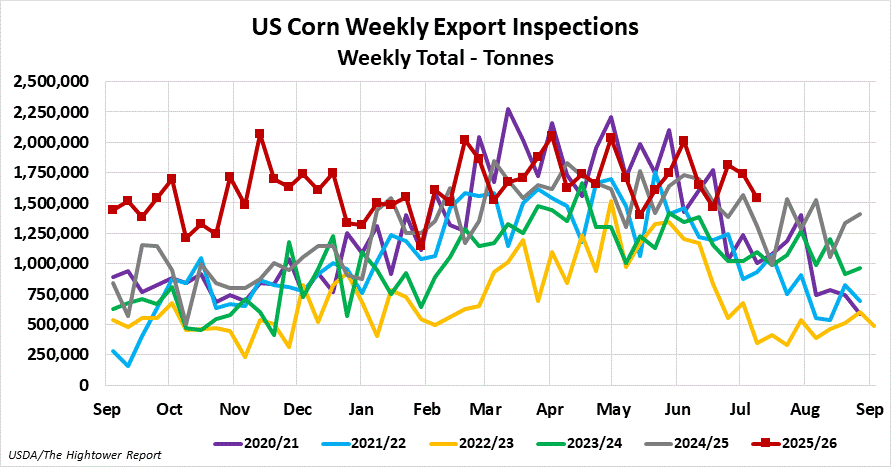
Corn export inspections for the week ending July 9 came in at 1,539,718 metric tonnes. Cumulative inspections year-to-date are 72,207,908 metric tonnes which is 24.9% above last year. This is 85.5% of the USDA's forecast for the 2025-26 marketing year versus the five year average of 78.2%.
WHEAT
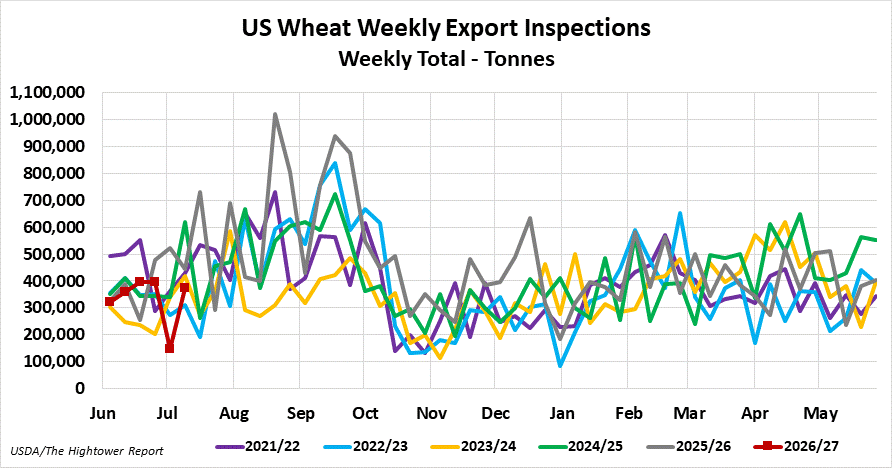
Wheat export inspections for the week ending July 9 came in at 373,611 metric tonnes. Cumulative inspections year-to-date are 1,892,675 metric tonnes which is 17.3% below last year. This is 9.0% of the USDA's forecast for the 2026-27 marketing year versus the five year average of 9.4%.
Definition
This report contains a weekly summary of grains weighed for export in metric tons, including totals for the current and previous market year to date. Included are grains prepared for export weekly by country of destination and port area.
Description
This report provides a weekly update of US exports of corn, wheat and soybeans. The data compiled in this report is a measure of actual exports leaving the country. Exports are covered in greater detail in the weekly Export Sales report, which is released on Thursday, but because this report is released out on Mondays, it offers an earlier glimpse of the week’s exports.
This report presents export inspections data for the week ending the previous Thursday. It also includes the data from the previous week and a year ago. It includes cumulative data for the current marketing year and the cumulative number for the same week a year ago.
Analysts like to compare the current year’s export inspections pace with previous years. They also measure the pace against the USDA’s export forecast for the entire marketing year. For example, if cumulative US soybean export inspections have reached 45% of the USDA’s forecast for the entire marketing year, while the five-year average for that week was only 40%, it would suggest that exports are running stronger than what the USDA has forecast. This could draw an analyst to conclude that the USDA will revise its export forecast higher in future Supply/Demand (WASDE) reports.
The reports also include detail on the destinations for the exports, which is helpful when tracking certain customers (China for example) whose buying patterns may be of particular interest.