| Recent History | |||||||
| On Feed | Placements | Marketings | On Feed | ||||
| Month | Million Head | % YoY | Million Head | % YoY | Million Head | % YoY | 90+ Days |
| Mar-26 | 11.549 | 99.8% | 1.711 | 92.8% | 1.634 | 94.6% | 6.805 |
| Apr-26 | 11.576 | 99.5% | 1.702 | 105.5% | 1.642 | 90.0% | 6.668 |
| May-26 | 11.584 | 101.8% | 1.704 | 90.3% | 1.551 | 88.2% | 6.712 |
| Jun-26 | 11.682 | 102.1% | 1.399 | 97.1% | 1.661 | 97.3% | 6.722 |
| Jul-26 | 11.370 | 102.2% | 1.422 | 89.0% | 1.620 | 92.6% | 6.722 |
| Aug-26 | 11.117 | 101.8% | 1.617 | 90.8% | 1.519 | 96.7% | 6.752 |
| Sep-26 | 11.163 | 100.7% | - | - | - | - | 6.882 |
| Cattle on Feed Estimates | |||||
| Estimates | |||||
| As Of | Average | Low | High | Last Year | |
| On Feed | Sep | 101.8% | 101.4% | 102.3% | 98.9% |
| Placements | Aug | 96.8% | 93.9% | 98.4% | 90.1% |
| Marketings | Aug | 96.1% | 95.3% | 96.4% | 86.4% |
Highlights
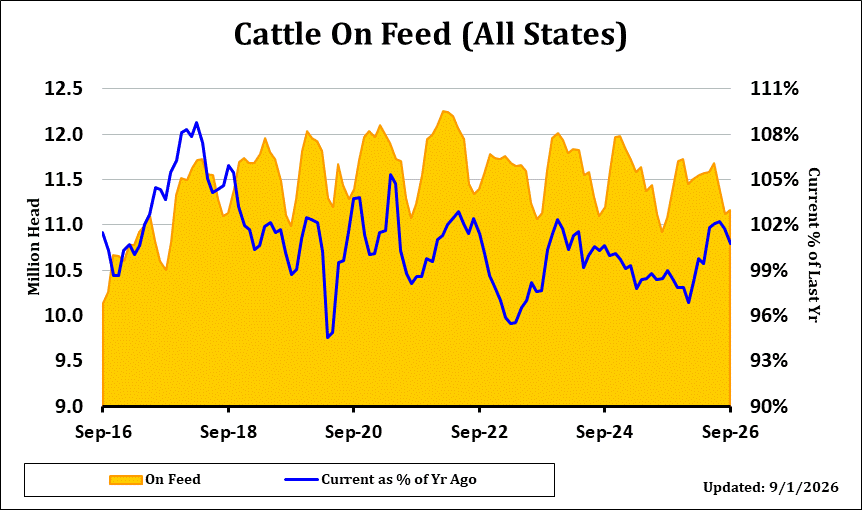
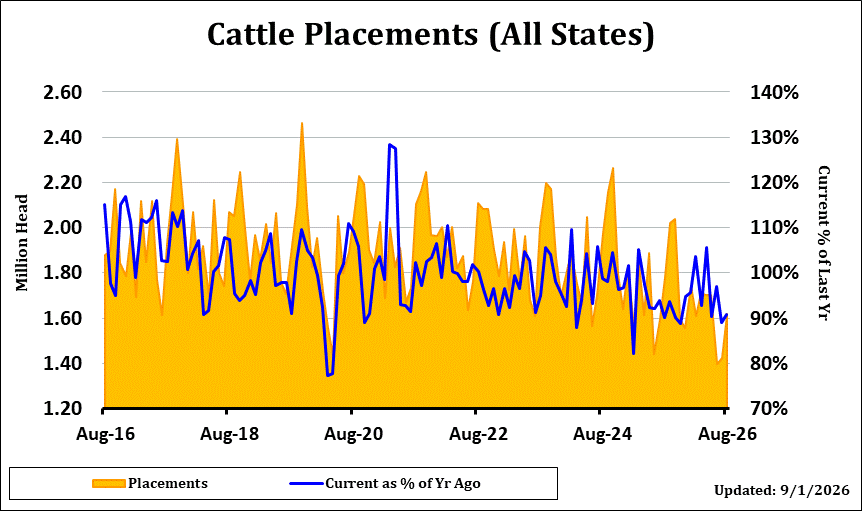
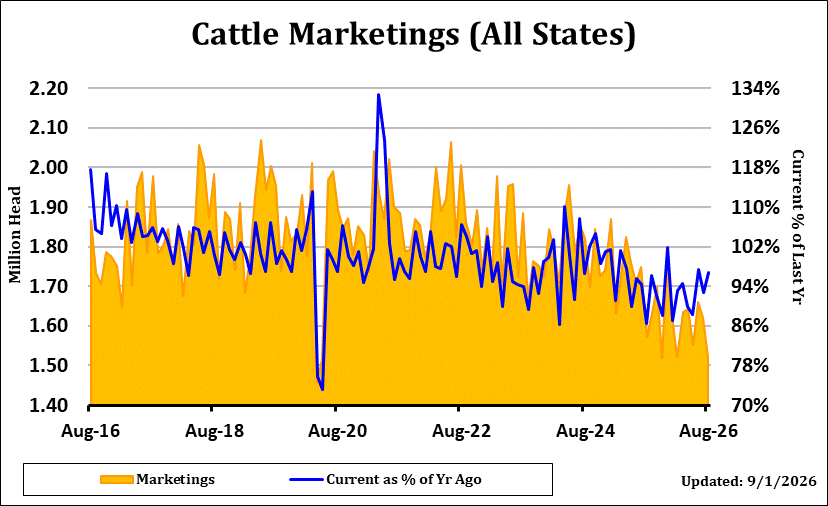
The USDA Cattle on Feed Report as of September 1st showed On Feed at 100.7% of last year, versus an average trade estimate of 101.8% with a range of 101.4% to 102.3%. Placements for August were 90.8% versus trade expectations of 96.8%, with a range of 93.9% to 98.4%. Marketings for August came in at 96.7% of last year as compared with the average estimate of 96.1% and a range of 95.3% to 96.4%.
Similar to last month, the placement reading came in well below even the lowest guess, and with On Feed also below the lowest guess, the report can be considered bullish. This is the 5th consecutive month On Feed numbers have been above the prior year. Marketings were the lowest since 1996 but above pre-report guesses. This week's sharp cattle pullback adds some bullishness to today's numbers, and a higher start is anticipated Monday morning. Feeders will also be dealing with the reopening of a New Mexico border crossing next week, but much of that may have been factored on this week's break. A turn back higher in December live cattle next could signal the start of another upswing to significant resistance near 229.00.
Definition
This file contains the monthly total number of cattle and calves on feed, placements, marketings, and other disappearances; by class and feedlot capacity for selected states; number of feedlots and fed cattle marketings by size groups for selected states. Data is organized by state and by U.S.
Description
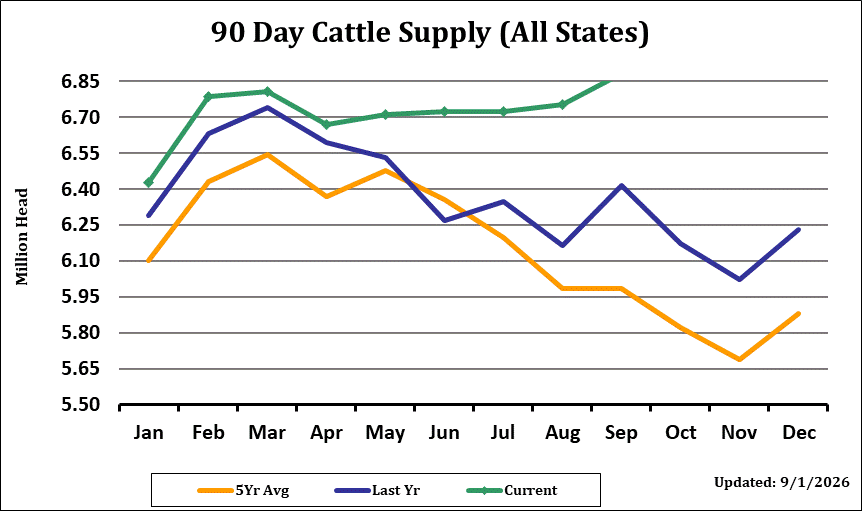
This report offers a timely update on the current makeup of the beef cattle herd. It is probably the most-watched of the USDA reports for the cattle markets and can be a market-moving event if it contains a surprise. The marketings number provides an indicator of recent demand and has the ability to affect the price of nearby futures contracts. The placements number offers insight on the future supply of market ready cattle and has a tendency to affect the deferred contracts. Cattle are placed on feed for anywhere from 90 to 180 days, so a large placements number in June would project large market-ready supply in the fall. Both the placements and the marketings numbers inform the on feed number, which is a measure of current supply. The report offers state-by-state breakdowns as well by various weight groupings, providing an opportunity for further, in-depth analysis. Cattle on Feed reports are usually released on Friday afternoons after the cattle futures market closes, and the results will be reflected on the opening the following Monday morning.