| Recent History | |||||||
| On Feed | Placements | Marketings | On Feed | ||||
| Month | Million Head | % YoY | Million Head | % YoY | Million Head | % YoY | 90+ Days |
| Jan-26 | 11.450 | 96.8% | 1.741 | 95.6% | 1.626 | 87.0% | 6.426 |
| Feb-26 | 11.510 | 98.2% | 1.611 | 103.7% | 1.522 | 93.2% | 6.786 |
| Mar-26 | 11.549 | 99.8% | 1.711 | 92.8% | 1.634 | 94.6% | 6.805 |
| Apr-26 | 11.576 | 99.5% | 1.702 | 105.5% | 1.642 | 90.0% | 6.668 |
| May-26 | 11.584 | 101.8% | 1.704 | 90.3% | 1.551 | 88.2% | 6.712 |
| Jun-26 | 11.682 | 102.1% | 1.399 | 97.1% | 1.661 | 97.3% | 6.722 |
| Jul-26 | 11.370 | 102.2% | - | - | - | - | 6.722 |
| Cattle on Feed Estimates | |||||
| Estimates | |||||
| As Of | Average | Low | High | Last Year | |
| On Feed | Jul | 102.2% | 101.1% | 103.3% | 98.4% |
| Placements | Jun | 98.8% | 93.7% | 106.0% | 92.1% |
| Marketings | Jun | 97.0% | 94.9% | 98.0% | 95.6% |
Highlights
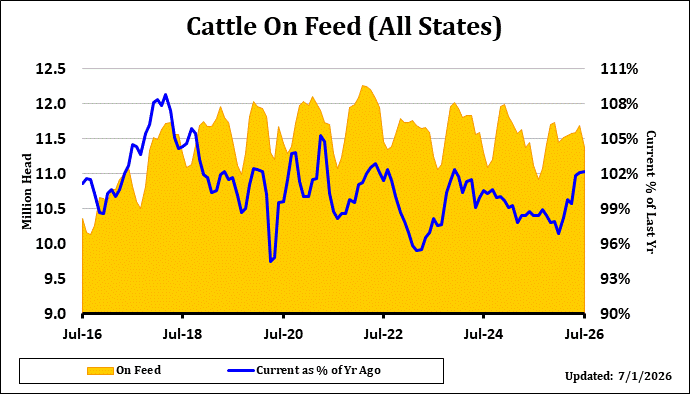
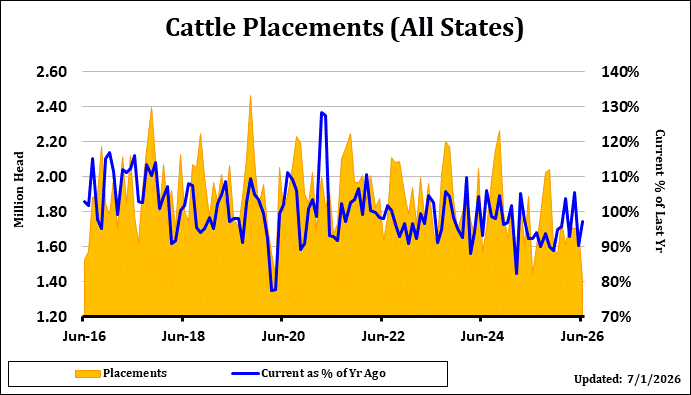
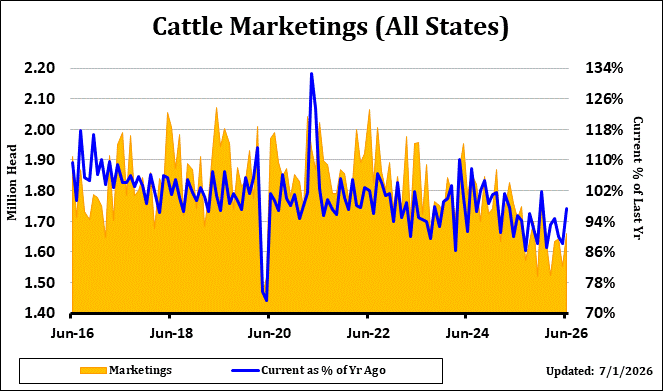
The USDA Cattle on Feed Report showed supply as of July 1st at 102.2% of last year versus average trade estimate of 102.2% with a range of 101.1% to 103.3%. Placements were 97.1% versus trade expectations of 98.8% and a range of 93.7% to 106.0%. Marketings came in at 97.3% of last year versus the average estimate of 97.0% and a range of 94.9% to 98.0%.
Semiannual cattle inventory report as of July 1: All cattle and calves in the United States totaled 94.2 million head, slightly above the 94.0 million head on July 1, 2025.
Today's report came in slightly friendly on the placement number but marketings and on feed were right on the guesses and we consider the report neutral. Placements were not likely low enough to spark a significant market reaction on Monday morning. The semiannual cattle inventory report came in slightly higher than a year ago, which may offset any slight bullishness from the placement number. Since the 1st of the year, average weekly beef cow slaughter has trended below a year ago and that was expected to reduce beef cows in the US but instead the herd was higher year-over-year.
Definition
This file contains the monthly total number of cattle and calves on feed, placements, marketings, and other disappearances; by class and feedlot capacity for selected states; number of feedlots and fed cattle marketings by size groups for selected states. Data is organized by state and by U.S.
Description
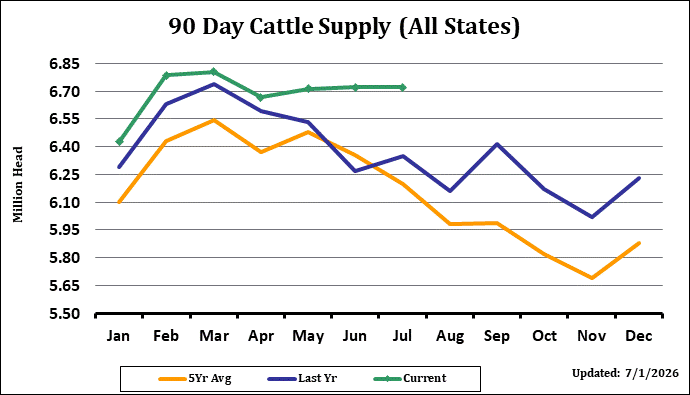
This report offers a timely update on the current makeup of the beef cattle herd. It is probably the most-watched of the USDA reports for the cattle markets and can be a market-moving event if it contains a surprise. The marketings number provides an indicator of recent demand and has the ability to affect the price of nearby futures contracts. The placements number offers insight on the future supply of market ready cattle and has a tendency to affect the deferred contracts. Cattle are placed on feed for anywhere from 90 to 180 days, so a large placements number in June would project large market-ready supply in the fall. Both the placements and the marketings numbers inform the on feed number, which is a measure of current supply. The report offers state-by-state breakdowns as well by various weight groupings, providing an opportunity for further, in-depth analysis. Cattle on Feed reports are usually released on Friday afternoons after the cattle futures market closes, and the results will be reflected on the opening the following Monday morning.