| Recent History | |||||||
| On Feed | Placements | Marketings | On Feed | ||||
| Month | Million Head | % YoY | Million Head | % YoY | Million Head | % YoY | 90+ Days |
| Nov-25 | 11.706 | 97.8% | 1.594 | 88.8% | 1.520 | 88.1% | 6.021 |
| Dec-25 | 11.727 | 97.9% | 1.555 | 94.7% | 1.774 | 101.8% | 6.230 |
| Jan-26 | 11.450 | 96.8% | 1.741 | 95.6% | 1.626 | 87.0% | 6.426 |
| Feb-26 | 11.510 | 98.2% | 1.611 | 103.7% | 1.522 | 93.2% | 6.786 |
| Mar-26 | 11.549 | 99.8% | 1.711 | 92.8% | 1.634 | 94.6% | 6.805 |
| Apr-26 | 11.576 | 99.5% | 1.702 | 105.5% | 1.642 | 90.0% | 6.668 |
| May-26 | 11.584 | 101.8% | - | - | - | - | 6.712 |
| Cattle on Feed Estimates | |||||
| Estimates | |||||
| As Of | Average | Low | High | Last Year | |
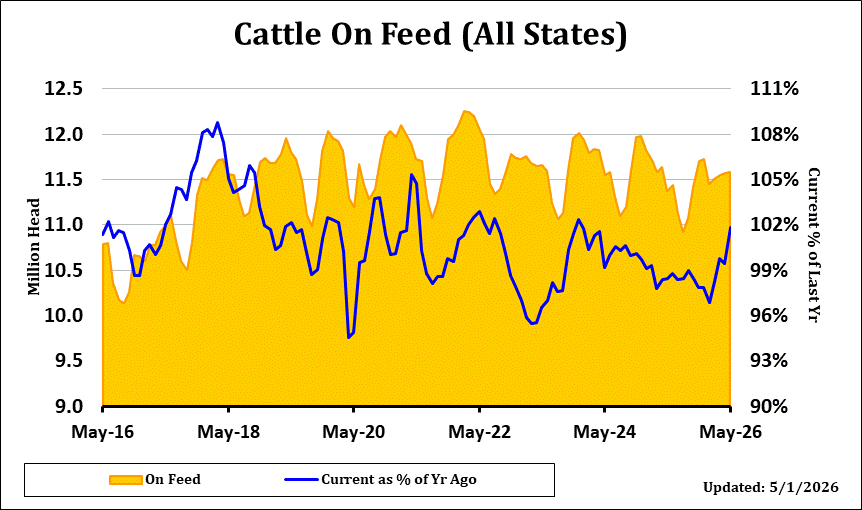
| On Feed | May | 101.4% | 100.2% | 102.4% | 98.5% |
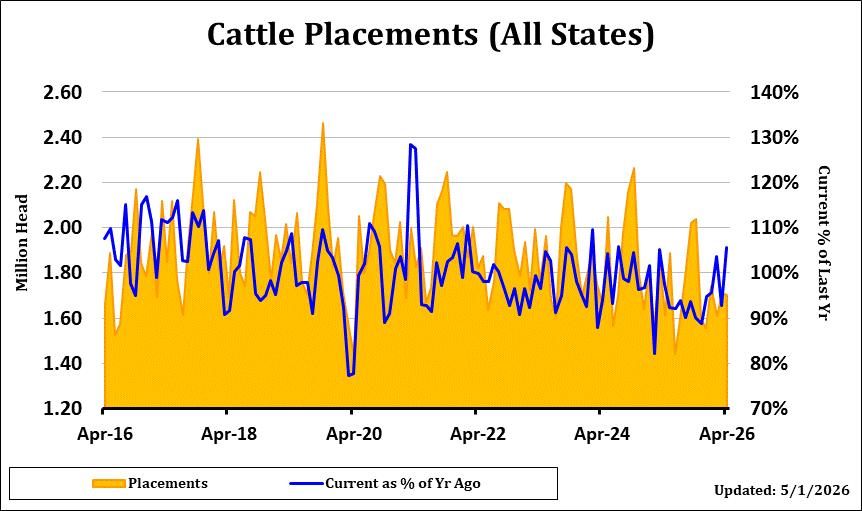
| Placements | Apr | 103.0% | 95.7% | 108.5% | 97.4% |
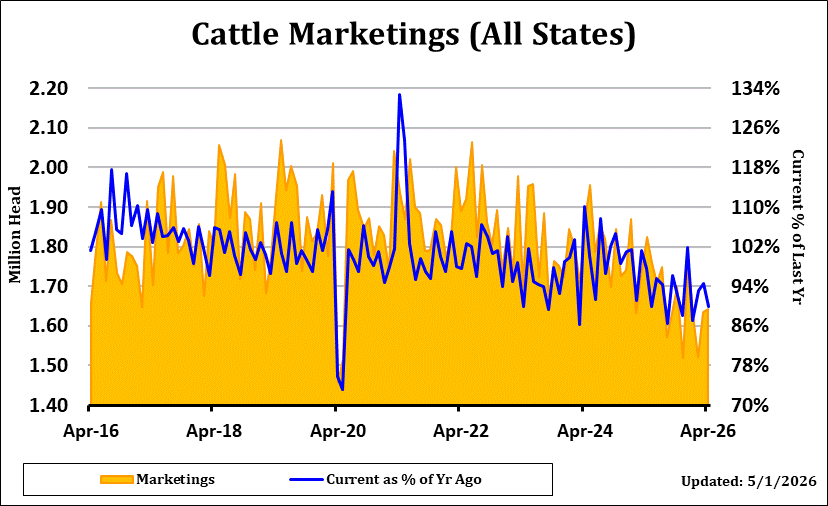
| Marketings | Apr | 90.5% | 89.7% | 91.7% | 97.5% |
Highlights
The USDA Cattle on Feed Report showed On Feed supply as of May 1st came in at 101.8% of last year, versus the average trade estimate of 101.4%, with a range of 100.2% to 102.4%. Placements were 105.5% versus trade expectations of 103.0% and a range of 95.7% to 108.5%. Marketings for April came in at 90.0% of last year as compared with the average estimate of 90.5% and a range of 89.7% to 91.7%.
Today's report is considered bearish with higher than expected placements, larger on feed numbers, and slightly lower than expected marketings, prompting calls for a lower opening on Tuesday. Drought conditions across the Plains appear to have pushed more cattle into feedlots, which may partly explain why feeder cattle fell $20 over the last 2 sessions. Live cattle has held firmer on strong cash readings, but it is typical for cash to make highs this time of year. Retail demand questions have been circulating in the market this week, as media stories about high meat and grocery prices have dampened bullish enthusiasm in cattle. This may continue next week if cash cattle trade remains steady to lower again. A weakening technical outlook raises the odds of a further setback next week.
Definition
This file contains the monthly total number of cattle and calves on feed, placements, marketings, and other disappearances; by class and feedlot capacity for selected states; number of feedlots and fed cattle marketings by size groups for selected states. Data is organized by state and by U.S.
Description
This report offers a timely update on the current makeup of the beef cattle herd. It is probably the most-watched of the USDA reports for the cattle markets and can be a market-moving event if it contains a surprise. The marketings number provides an indicator of recent demand and has the ability to affect the price of nearby futures contracts. The placements number offers insight on the future supply of market ready cattle and has a tendency to affect the deferred contracts. Cattle are placed on feed for anywhere from 90 to 180 days, so a large placements number in June would project large market-ready supply in the fall. Both the placements and the marketings numbers inform the on feed number, which is a measure of current supply. The report offers state-by-state breakdowns as well by various weight groupings, providing an opportunity for further, in-depth analysis. Cattle on Feed reports are usually released on Friday afternoons after the cattle futures market closes, and the results will be reflected on the opening the following Monday morning.