| Recent History | |||||||
| On Feed | Placements | Marketings | On Feed | ||||
| Month | Million Head | % YoY | Million Head | % YoY | Million Head | % YoY | 90+ Days |
| Oct-25 | 11.418 | 98.4% | 2.040 | 90.0% | 1.698 | 92.0% | 6.172 |
| Nov-25 | 11.706 | 97.8% | 1.594 | 88.8% | 1.520 | 88.1% | 6.021 |
| Dec-25 | 11.727 | 97.9% | 1.555 | 94.7% | 1.774 | 101.8% | 6.230 |
| Jan-26 | 11.450 | 96.8% | 1.741 | 95.6% | 1.626 | 87.0% | 6.426 |
| Feb-26 | 11.510 | 98.2% | 1.611 | 103.7% | 1.522 | 93.2% | 6.786 |
| Mar-26 | 11.549 | 99.8% | 1.709 | 92.7% | 1.632 | 94.5% | 6.805 |
| Apr-26 | 11.576 | 99.5% | - | - | - | - | 6.670 |
| Cattle on Feed Estimates | |||||
| Estimates | |||||
| As Of | Average | Low | High | Last Year | |
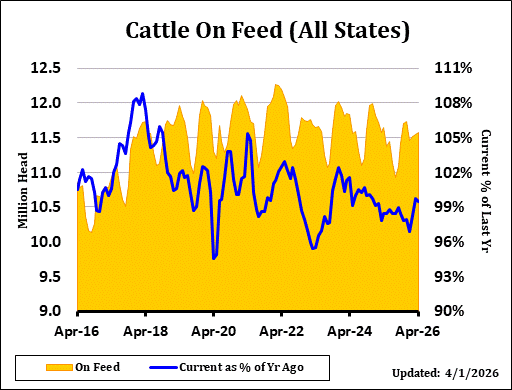
| On Feed | Apr | 99.7% | 99.1% | 100.1% | 98.4% |
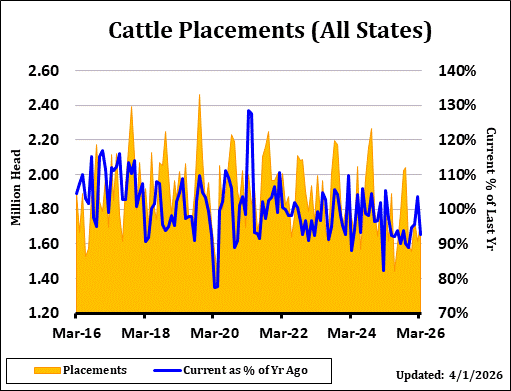
| Placements | Mar | 93.3% | 89.8% | 95.4% | 105.2% |
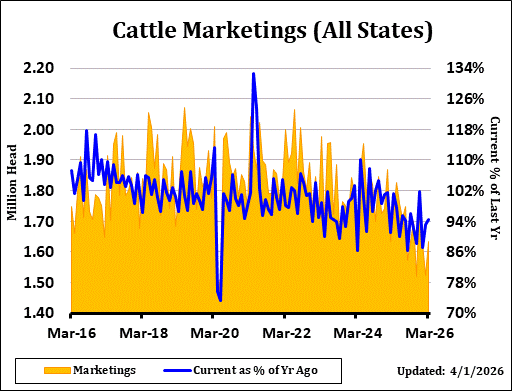
| Marketings | Mar | 93.6% | 92.3% | 95.3% | 101.2% |
Highlights
The USDA Cattle on Feed Report as of April 1st came in at 99.5% of last year's on feed versus the average trade estimate of 99.7%, with a range of 99.1% to 100.1%. Placements for the month of March were at 92.7% versus trade expectations of 93.3% and a range of 89.8% to 95.4%. Marketings for March came in at 94.5% of last year, as compared with the average estimate of 93.6% and a range of 92.3% to 95.3%.
The report is mostly neutral. Placements were the lowest since 2020 when COVID disrupted the industry, but that was expected. Worsening drought conditions may have a more dramatic effect, moving more cattle into feedlots in next month's report as drought conditions have worsened across the cattle feeding areas over the last 2 1/2 weeks. Over half of the cattle region is in drought conditions. There was 1 additional marketing day this year than last, which is likely why marketings came in slightly higher than the guesses. Higher weights are offsetting some of the lower slaughter rates.
Definition
This file contains the monthly total number of cattle and calves on feed, placements, marketings, and other disappearances; by class and feedlot capacity for selected states; number of feedlots and fed cattle marketings by size groups for selected states. Data is organized by state and by U.S.
Description
This report offers a timely update on the current makeup of the beef cattle herd. It is probably the most-watched of the USDA reports for the cattle markets and can be a market-moving event if it contains a surprise. The marketings number provides an indicator of recent demand and has the ability to affect the price of nearby futures contracts. The placements number offers insight on the future supply of market ready cattle and has a tendency to affect the deferred contracts. Cattle are placed on feed for anywhere from 90 to 180 days, so a large placements number in June would project large market-ready supply in the fall. Both the placements and the marketings numbers inform the on feed number, which is a measure of current supply. The report offers state-by-state breakdowns as well by various weight groupings, providing an opportunity for further, in-depth analysis. Cattle on Feed reports are usually released on Friday afternoons after the cattle futures market closes, and the results will be reflected on the opening the following Monday morning.