| Consensus | Consensus Range | Actual | Previous | Revised | |
| Initial Claims - Level | 200K | 195K to 205K | 197K | 197K | 198K |
| Initial Claims - Change | -1K | -1K | 0K | ||
| 4-Week Moving Average | 200K | 202.25K | 202.5K |
Highlights
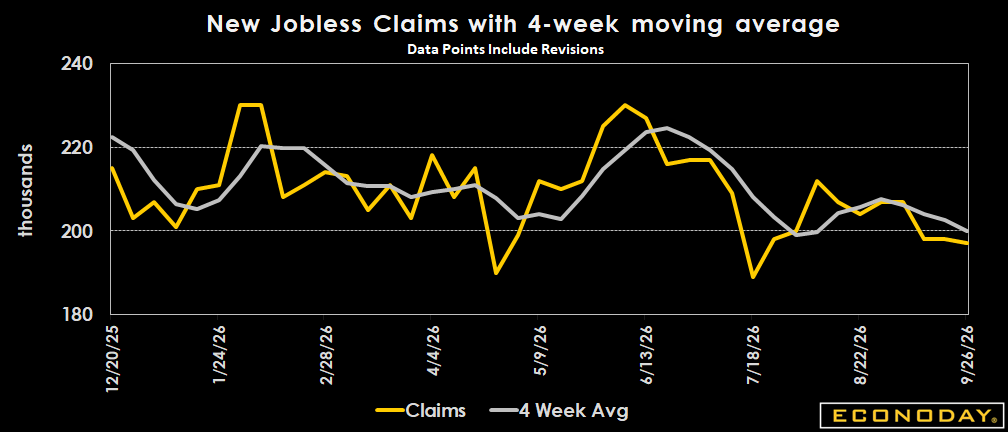
Still a stagnant labor market. Initial jobless claims maintain their holding pattern just below the 200,000 mark for the third straight week, while the four-week moving average dipped again for the fourth consecutive week. Longer-term claims continue their downward trajectory away from the 1.8 million threshold.
Initial jobless claims came in slightly lower than expected, with the level reported in the week ending September 26 down 1,000 from the revised 198,000 level reported for the prior week (previously 197,000). The September week’s level compares to the consensus of 200,000 in the Econoday survey of forecasters.
The four-week moving average is down by 2,500 to 200,000 in the September 19 week.
Seasonal factors had expected a decrease in unadjusted claims of 6,747 (-4.1 percent) from the previous week but instead fell by 7,979 (-4.8 percent).
No states reported a notable rise in unadjusted first-time claims or a significant decline.
Insured unemployment was at 1.701 million in the September 19 week, with the prior week’s level revised down to 1.712 million from 1.719 million. Continuing claims are lower by 220,000 vs. the same week a year ago. The four-week moving average is down 18,500 to 1.724 million, from 1.742 million in the September 12 week. The insured rate of unemployment remained at 1.1 percent in the September 19 week.
Market Consensus Before Announcement
Forecasters have tended to overestimate claims, now see them at 200K versus 197K a week earlier.
Definition
New unemployment claims are compiled weekly to show the number of individuals who filed for unemployment insurance for the first time. An increasing (decreasing) trend suggests a deteriorating (improving) labor market. The four-week moving average of new claims smooths out weekly volatility.
Description
Jobless claims are an easy way to gauge the strength of the job market. The fewer people filing for unemployment benefits, the more have jobs, and that tells investors a great deal about the economy. Nearly every job comes with an income that gives a household spending power. Spending greases the wheels of the economy and keeps it growing, so a stronger job market generates a healthier economy.
There's a downside to it, though. Unemployment claims, and therefore the number of job seekers, can fall to such a low level that businesses have a tough time finding new workers. They might have to pay overtime wages to current staff, use higher wages to lure people from other jobs, and in general spend more on labor costs because of a shortage of workers. This leads to wage inflation, which is bad news for the stock and bond markets. Federal Reserve officials are always on the look-out for inflationary pressures.
By tracking the number of jobless claims, investors can gain a sense of how tight, or how loose, the job market is. If wage inflation looks threatening, it's a good bet that interest rates will rise, bond and stock prices will fall, and the only investors in a good mood will be the ones who tracked jobless claims and adjusted their portfolios to anticipate these events.
Just remember, the lower the number of unemployment claims, the stronger the job market, and vice versa.