| Consensus | Consensus Range | Actual | Previous | Revised | |
| Initial Claims - Level | 205K | 190K to 215K | 200K | 189K | 190K |
| Initial Claims - Change | 10K | -26K | -25K | ||
| 4-Week Moving Average | 203.25K | 207.5K | 207.75K |
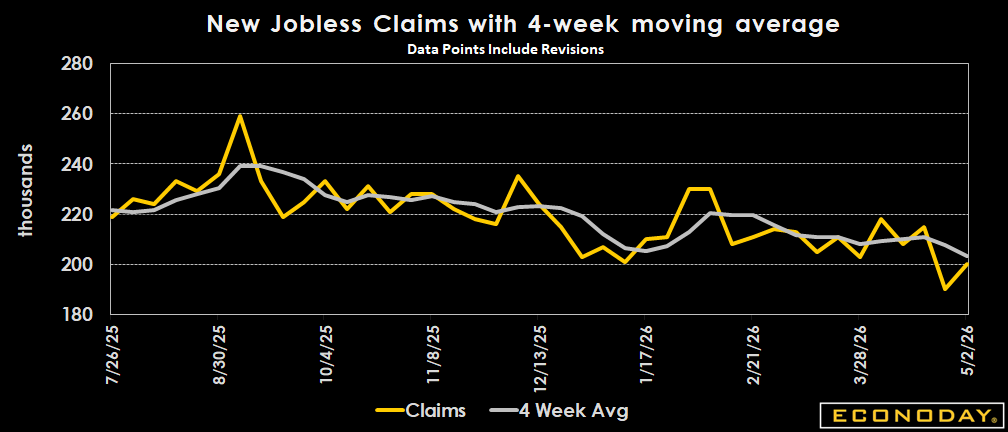
Highlights
The volatile trend continues in initial jobless claims, with a bounce in last week's headline number following the prior week's record low reading. Employment conditions have stabilized at a slow hiring pace coupled with a low level of layoffs. The downward trajectory in longer-term claims now below 1.8 million for the second straight week continues.
Initial jobless claims came in less than expected, with the level reported in the week ending May 2 up 10,000 from the revised 190,000 level reported for the prior week (previously 189,000). The May 2 week's level compares to the consensus of 205,000 in the Econoday survey of forecasters. The four-week moving average declined by 4,500 to 203,250 in the May 2 week.
Seasonal factors had expected a decrease in unadjusted claims of 8,748 (-4.8 percent) from the previous week, but instead there was a very minor increase of 299 (+0.2 percent).
Only California (+2,523) reported a noticeable rise in unadjusted first-time claims, while no states reported significant declines.
Insured unemployment was at 1.766 million in the April 25 week, with the prior week's level revised to 1.776 million from 1.785 million. Continuing claims are lower by 110,000 vs. the same week a year ago. The four-week moving average is down 5,250 to 1.790 million, from a downwardly revised 1.795 million in the April 18 week. The insured rate of unemployment remained at 1.2 percent in the April 25 week.
Market Consensus Before Announcement
Claims expected to rebound to 205K in the latest week after a surprise 26K drop to 189k a week ago.
Definition
New unemployment claims are compiled weekly to show the number of individuals who filed for unemployment insurance for the first time. An increasing (decreasing) trend suggests a deteriorating (improving) labor market. The four-week moving average of new claims smooths out weekly volatility.
Description
Jobless claims are an easy way to gauge the strength of the job market. The fewer people filing for unemployment benefits, the more have jobs, and that tells investors a great deal about the economy. Nearly every job comes with an income that gives a household spending power. Spending greases the wheels of the economy and keeps it growing, so a stronger job market generates a healthier economy.
There's a downside to it, though. Unemployment claims, and therefore the number of job seekers, can fall to such a low level that businesses have a tough time finding new workers. They might have to pay overtime wages to current staff, use higher wages to lure people from other jobs, and in general spend more on labor costs because of a shortage of workers. This leads to wage inflation, which is bad news for the stock and bond markets. Federal Reserve officials are always on the look-out for inflationary pressures.
By tracking the number of jobless claims, investors can gain a sense of how tight, or how loose, the job market is. If wage inflation looks threatening, it's a good bet that interest rates will rise, bond and stock prices will fall, and the only investors in a good mood will be the ones who tracked jobless claims and adjusted their portfolios to anticipate these events.
Just remember, the lower the number of unemployment claims, the stronger the job market, and vice versa.