| Consensus | Consensus Range | Actual | Previous | Revised | |
| Initial Claims - Level | 213K | 197K to 220K | 202K | 210K | 211K |
| Initial Claims - Change | -9K | 5K | 6K | ||
| 4-Week Moving Average | 207.75K | 210.50K | 210.75K |
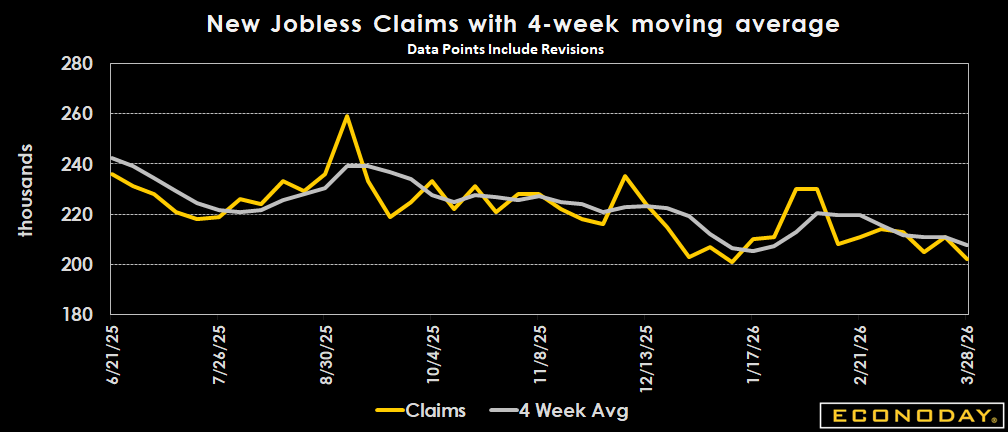
Highlights
Initial jobless claims are down 9,000 to 202,000 in the week ending March 28. This is below the consensus of 213,000 in the Econoday survey of forecasters. The decrease is slightly exaggerated by seasonal adjustment that anticipated an increase. Unadjusted jobless claims are 184,845, a decline of 1.0 percent from the prior week where the seasonal adjustment is for a 3.7 percent rise in new claims. The last weeks of March and the first weeks of April can be difficult to adjust due to the changing dates of the spring holidays. As a result, the week-to-week moves can be somewhat volatile. The seasonally adjusted four-week moving average is down 3,000 in the March 28 week to 207,750, suggesting that the underlying trend for new claims remains fairly steady in the low 200,000's and consistent with low levels of layoff activity.
Insured unemployment claims are up 25,000 to 1.841 million in the March 21 week. The four-week moving average is down 7,500 to 1.839 million in the March 21 week. The level of those receiving benefits is not exhibiting week-to-week alteration and is at levels in line with modest unemployment rates. The insured rate of unemployment is 1.2 percent in the March 21 week, where it has been since the November 29, 2025 week. For workers eligible for unemployment benefits, the labor market is essentially stable.
Market Consensus Before Announcement
Claims are seen up at 213K versus 210K in the previous week.
Definition
New unemployment claims are compiled weekly to show the number of individuals who filed for unemployment insurance for the first time. An increasing (decreasing) trend suggests a deteriorating (improving) labor market. The four-week moving average of new claims smooths out weekly volatility.
Description
Jobless claims are an easy way to gauge the strength of the job market. The fewer people filing for unemployment benefits, the more have jobs, and that tells investors a great deal about the economy. Nearly every job comes with an income that gives a household spending power. Spending greases the wheels of the economy and keeps it growing, so a stronger job market generates a healthier economy.
There's a downside to it, though. Unemployment claims, and therefore the number of job seekers, can fall to such a low level that businesses have a tough time finding new workers. They might have to pay overtime wages to current staff, use higher wages to lure people from other jobs, and in general spend more on labor costs because of a shortage of workers. This leads to wage inflation, which is bad news for the stock and bond markets. Federal Reserve officials are always on the look-out for inflationary pressures.
By tracking the number of jobless claims, investors can gain a sense of how tight, or how loose, the job market is. If wage inflation looks threatening, it's a good bet that interest rates will rise, bond and stock prices will fall, and the only investors in a good mood will be the ones who tracked jobless claims and adjusted their portfolios to anticipate these events.
Just remember, the lower the number of unemployment claims, the stronger the job market, and vice versa.